


ABSTRACT
We analyze data from SDO (AIA, HMI), Hinode (SOT, XRT, EIS), and STEREO (EUVI) of a solar eruption sequence of 2011 June 1 near 16:00 UT, with an emphasis on the early evolution toward eruption. Ultimately, the sequence consisted of three emission bursts and two filament ejections. SDO/AIA 304 Å images show absorbing-material strands initially in close proximity which over ∼20 minutes form a twisted structure, presumably a flux rope with ∼1029 erg of free energy that triggers the resulting evolution. A jump in the filament/flux rope's displacement (average velocity ∼20 km s−1) and the first burst of emission accompanies the flux-rope formation. After ∼20 more minutes, the flux rope/filament kinks and writhes, followed by a semi-steady state where the flux rope/filament rises at (∼5 km s−1) for ∼10 minutes. Then the writhed flux rope/filament again becomes MHD unstable and violently erupts, along with rapid (50 km s−1) ejection of the filament and the second burst of emission. That ejection removed a field that had been restraining a second filament, which subsequently erupts as the second filament ejection accompanied by the third (final) burst of emission. Magnetograms from SDO/HMI and Hinode/SOT, and other data, reveal several possible causes for initiating the flux-rope-building reconnection, but we are not able to say which is dominant. Our observations are consistent with magnetic reconnection initiating the first burst and the flux-rope formation, with MHD processes initiating the further dynamics. Both filament ejections are consistent with the standard model for solar eruptions.
Export citation and abstract BibTeX RIS
1. INTRODUCTION
Filament ejections are often one aspect of a broader solar eruption that can include a solar flare observable at various wavelengths, and expulsion of a coronal mass ejection (CME). Studies of various observational data, including filament motions, have resulted in an understanding of the broader aspects of eruptions (e.g., Hirayama 1974; Shibata et al. 1995; Moore et al. 2001). Observing the earliest motions of filaments near the time of eruption onset tells us about the coronal magnetic field evolution during the eruption's incipient stages.
In a series of studies we have focused on these early stages of eruption onset (e.g., Sterling et al. 2007a, 2007b, 2010; Moore & Sterling 2006 and references therein), primarily using filament motions as markers of the earliest activity. At least for many events, the filament-rise onset starts prior to the onset of the strong flaring emissions, and often this early rise is relatively slow ("slow-rise phase") compared to the later faster rise ("fast-rise phase"). This phenomenon has been observed in many studies (e.g., Roy & Tang 1975; Sakurai 1976; Martin 1980; Tandberg-Hanssen et al. 1980; Kahler et al. 1988; Schmieder et al. 2008; Liewer et al. 2009; Cheng et al. 2010; Xu et al. 2010; Règnier et al. 2011).
Also, for some time, studies have found brightenings in Hα, EUV, or X-rays during the period prior to eruption (Bumba & Kriviskỳ 1959; Martin 1980; Kai et al. 1983; Van Hoven & Hurford 1984; Harrison 1986; Fárník et al. 2002; Chifor et al. 2007; Kim et al. 2007). There is a question of whether these brightenings are purely random and just happen to be observed around the time of a flare but are not actually connected to the eruption (Zhang et al. 2008). However, there have now been several observations where the brightenings are coordinated with filament motions during the pre-eruption (slow-rise) phase (Sterling & Moore 2005; Nagashima et al. 2007; Sterling et al. 2007a; Liu et al. 2009), and so at least in some situations the preflare brightenings and filament motions are connected. That is, the mechanism causing the brightenings is also likely to be responsible for the rise in the filament. This is consistent with the "tether-weakening" mechanism (Moore & Roumeliotis 1992) or with the "tether-cutting" mechanism (e.g., Moore & LaBonte 1980; Moore et al. 2001), whereby the reconnection of an emerging field with an ambient field or magnetic flux cancellation beneath the filament produces, respectively, either a "lengthening" of (weakening and relaxing of) field that ties down the filament, or a pinching off of the field beneath the filament, with the upper pinched-off (reconnected) field wrapping around the filament (that is, this field is added to the outside of the twisted flux rope in which the filament sits). In the case where the tether cutting evolves into a positive-feedback loop, "runaway tether-cutting reconnection" ensues, resulting in a consequent rapid outward movement of the filament and strong energy release producing a flare. Tether-weakening reconnection could produce microflare brightening and a slow filament rise (e.g., Sterling et al. 2007a). We believe that runaway tether cutting occurs in nearly all flares (e.g., Moore & Sterling 2006) where flare loops form on the near-solar-surface side of the reconnecting field (at least in a simplified geometry; see Figure 1 of Moore et al. 2001). Reconnection resulting in solar eruptions has also been discussed in terms of a "flux-cancellation" mechanism (e.g., van Ballegooijen & Martens 1989), which is similar to the tether-weakening and tether-cutting ideas.
We are now reconsidering eruption onset, and in particular early-phase filament motions, with new data available from the Solar Dynamics Observatory (SDO) and Hinode (Kosugi et al. 2007) spacecraft. In Sterling et al. (2011a), we studied the onset of a confined filament eruption using data from SDO. We found evidence supporting tether weakening and tether cutting with brightenings below the filament during the slow rise occurring at a location where opposite-flux polarities apparently merged, and with those pre-eruption microflare brightenings occurring in conjunction with upward motions of the filament. There were, however, also two features of the eruption that we observed that may challenge the tether-cutting picture. First, the main preflare brightenings during the slow-rise phase were more clearly visible above the filament, rather than below the filament, and second, we observed that the main flare loops seemed to develop when the legs of an arcade loop overlying the filament and nearly orthogonal to the filament came together, rather than evolving smoothly from the inferred pre-eruption sheared core field; both of these aspects differ from the simplest picture of tether cutting as presented in, e.g., the schematic of Moore et al. (2001). We also found that at the start of the filament's fast eruption, outer regions of the cool filament became heated, emitting in EUV as the filament erupted, appearing to form a cocoon surrounding cooler filament material. Another feature we observed was that, at least at the time of its fast rise, the filament showed evidence of twisting motions (or a helically distorted field), similar to helical features observed by others near the time of eruption onset (e.g., van Driel-Gesztelyi et al. 2000; Martin 2003; Rust & LaBonte 2005; Williams et al. 2005, 2009; Liu et al. 2009).
Here we continue our investigations using SDO data of an eruption of 2011 June 1. Fortunately, this event's onset occurred just prior to the night-time portion of the Hinode spacecraft's orbit, and so we also have Hinode data for this important phase of this eruption. We also use observations from STEREO, which allows us to examine the eruption from a near-limb perspective, complementing the on-disk perspective of SDO and Hinode. Unlike our initial study in Sterling et al. (2011a), this event is an ejective rather than a confined eruption. It erupts in a complex magnetic setting producing a cascade effect that results in an adjacent eruption from the same region in close time sequence. Other filament eruption studies using SDO data are presented in Liu et al. (2009), Règnier et al. (2011), Li et al. (2011), and Su et al. (2011).
2. INSTRUMENTATION AND DATA
This event occurred on 2011 June 1 in NOAA AR 11226, peaking in GOES soft X-ray flux at 17:08 UT at the C4.1 level. Figure 1 shows the GOES soft X-ray time profile. There are three prominent separate peaks in this event, identified as episodes 1, 2, and 3, giving it a more complex GOES profile than that of many "standard" events. Nonetheless, we expect that the eruption retains the basic features of other eruptions.
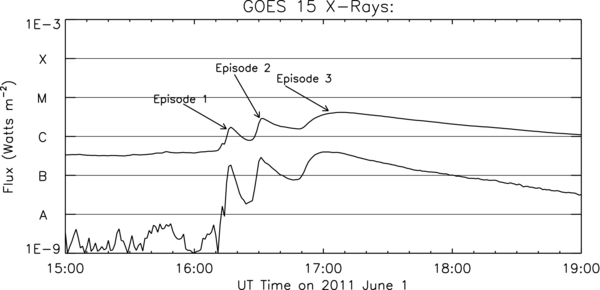
Figure 1. Soft X-ray flux from the GOES 15 satellite, over the 1–8 Å and 0.5–4 Å passbands. The indicated three episodes all emanate from the same active region and are part of the same overall cascade eruption, as discussed in the text.
Download figure:
Standard image High-resolution imageOur primary data source for context are EUV images from the Atmospheric Imaging Assembly (AIA; Lemen et al. 2012) on SDO. The AIA data are of very high cadence (∼12 s) with 0 6 pixels, and include wavelengths of 1700, 1600, 304, 171, 193, 211, 335, 94, and 131 Å, roughly ranging in order from the coolest to hottest response, although the detailed temperature response depends on the target being observed (O'Dwyer et al. 2010). We typically used 24 s cadence image sequences for this study. We also use line-of-sight magnetic field data from the Helioseismic and Magnetic Imager (HMI; Scherrer et al. 2012) on SDO, with cadence of 45 s and a sampling of 05 pixel−1. As the event was centered near S21E16, it was far enough on-disk for the line-of-sight fields to not have significant near-limb effects.
From Hinode we use data from the X-Ray Telescope (XRT; Golub et al. 2007), which takes images of coronal emissions ≳ 1 MK, and is therefore sensitive to hot corona and flaring emissions but not sensitive to the cooler corona detected by most of the AIA channels. The bright emission in XRT images unambiguously comes from locations of high temperatures, while AIA can generally also see cooler emissions. In addition, we use data from Hinode's Solar Optical Telescope (SOT), which is a 50 cm white-light telescope/focal plane package combination (Tsuneta et al. 2008). We use line-of-sight filtergraph magnetic data from SOT's narrowband filter imager, which has 008 pixels. Thus its resolution of ∼016 is substantially higher than that of HMI, which is ∼1''. But HMI images the entire Sun, while SOT has a field of view limited to 328'' × 164''. We use data from the EUV Imaging Telescope (EIS; Culhane et al. 2007), which is also from Hinode. EIS ran flare study 461, which performs west-to-east raster scans with its 2'' slit in various spectral lines and requiring 317 s per scan. It has a spatial resolution of ∼1'' in the north–south direction, and an effective spatial resolution of ∼6'' in the east–west direction; more specifically, the slit is moved in 6'' steps in the east–west direction over the course of the scan. The slit position was above an interesting feature at the start of the eruption, providing useful spectral information for the event.
We supplement these observations, which saw the eruption as an "on-disk" event, with observations from the SECCHI/EUVI instrument on the STEREO-B spacecraft (Wuelser et al. 2004), which was well placed to observe the eruption as a "near-limb" event, occurring on the solar west limb from its perspective. EUVI observes with four EUV filters with 16 pixels. For this event, the cadence was 2.5 minutes in the 195 Å filter, and more coarse in the remaining three filters. Therefore our discussion is restricted to the 195 Å EUVI observations, although we also inspected in detail the 304 Å images of the eruption and determined that, due to the lower cadence, they add no additional information important to our concerns. The source region of the eruption was occulted by the solar limb from the perspective of the STEREO-A satellite.
We also examined ground-based Hα images from the Big Bear Solar Observatory of this event, but these added no new information since the quality of the images was limited due to weather.
3. OBSERVATIONS
3.1. Morphology and Evolution of the Cascade Eruption
Figures 2 and 3, and the corresponding online videos, show the overall evolution of the eruption in AIA 193 Å and 304 Å filters, respectively. Figures 2(a) and 3(a) show the situation prior to the start of the eruption. A filament, particularly nondescript from this AIA on-disk perspective, overlays the primary neutral line of the active region. Overall, the region is grossly bipolar, although there is a positive-polarity island inside negative polarity, which we call an "intruding positive polarity," located at about (−315, −345). From about 16:04 UT, a brightening starts near the southern base of the neutral line in the vicinity of the intruding positive polarity; this brightening is apparent in both hotter (Figures 2(b)) and cooler (Figure 3(b)) AIA images. This brightening eventually produces the episode 1 peak in the GOES profile of Figure 1, and also leads to enhanced motions and brightenings, most obvious in the 304 Å images, in the portion of the filament indicated by the northern arrow of Figure 3(b).

Figure 2. Images showing different phases of the eruption from the AIA 193 Å channel. Panels (a) and (f) include line-of-sight magnetograms from HMI, with red and green representing positive and negative polarities, with contours of 100 and 750 G. Panel (a) is prior to substantial eruptive activity. The filaments that eventually erupt are difficult to detect prior to eruption, but reside above the main north–south neutral line of the region prior to eruption. Substantial eruption activity begins with a brightening near the southern end of the filament, indicated by the lower arrow in (b), and this is followed by increased filament activity, indicated by the upper arrow. In (c), the filament (arrow) has undergone writhing. In (d) this filament (arrows) begins to erupt. Panel (e) shows eruption of a second filament (arrows). Panel (f) shows flare loops (arrows) from the second filament eruption. North is upward and west to the right in these and all other solar images in this paper. The angled line in panel (b) is a two-component fiducial line, along which the distance traversed by the first erupting filament was measured in Figure 4 below. The arrow in 2(a) is a location where flux cancellation could have helped trigger the eruption; see Section 3.3 of the text.(An animation of this figure is available in the online journal.)
Download figure:
Standard image High-resolution image
Figure 3. Same as Figure 2, except with images from the AIA 304 Å channel.(An animation of this figure is available in the online journal.)
Download figure:
Standard image High-resolution imageFrom about 16:13 UT the filament begins to writhe, rising and bulging out, especially prominently at the location of the arrow in Figures 2(c) and 3(c). The filament approximately maintains this circumstance, that is, deformed by writhing, but not showing rapid outward motions until about 16:28 UT. At that time the filament "detaches" from the surface on its southeast end, again near the location of the intruding positive polarity. The rest of the filament follows and erupts outward, leaving behind flare ribbons on the solar surface, prominent in the 304 Å images and video (Figure 3), and eventually flare loops, more prominent in the 193 Å images and video (Figure 2). The arrows in Figures 2(d) and 3(d) point out the erupting filament. With this fuller view of the filament, it becomes apparent that the earliest brightenings occur on a rather localized portion of the filament, near its southern end; apparently this portion of the filament first becomes disrupted, and then erupts outward bringing the northern portion of the filament along with it. The detaching of the filament and consequent solar X-ray flare (occurring via the "standard model" for solar flares; Moore & Sterling 2006 and references therein) results in the episode 2 peak in the GOES plot of Figure 1. In this case, only a rather localized portion of the full (first) erupting filament kinks and writhes, which is somewhat different from other cases where it is obvious that the full filament structure writhes (e.g., Ji et al. 2003)
After the eruption of this first filament, a second filament lifts off from the surface, as pointed out by the arrows in Figures 2(e) and 3(e). It appears to have originated from further north along the same neutral line as that of the first filament. Its release was apparently triggered by the ejection of the first filament, and likely due to the first filament eruption removing magnetic field lines whose tension and pressure were vital in restraining the outward-pushing pressure of the sheared field holding the second filament. This style of sympathetic eruption has been observed before (e.g., Sterling & Moore 2004; Liu et al. 2009; Schrijver & Title 2011), and discussed via numerical simulations by Török et al. (2011). This second filament eruption builds its own flare loops and strong soft X-ray emission, producing the episode 3 peak in the GOES light curve of Figure 1. The arrows in Figures 2(f) and 3(f) show the relatively large flare loops resulting from the ejection of the second filament.
Figure 4(a) shows the motions of the first erupting filament as a function of time. Despite this filament being not as distinct as in some others we have studied (e.g., Sterling et al. 2011a), we can still follow the leading edge of the filament (or emissions surrounding a filament or flux rope) as observed in the AIA 193 Å channel. As usual, our procedure is to: (1) observe visually the path of the filament; (2) determine a fiducial line that represents the path of motion of a "strongly eruptive" portion of the filament over the duration we wish to do the tracking; (3) draw this fiducial line on each image of a movie sequence of the eruption; (4) select visually where that portion of the filament we are tracking intercepts the fiducial (or in some images, where the portion of the filament we are tracking is off of the fiducial, we select a point on the fiducial where a line drawn from that location being tracked intercepts normally the fiducial); (5) click and record the selected point along the fiducial; (6) we then select a location along the fiducial and near the base of the filament to define as the zero-displacement level of the filament, and we determine the filament-rise plot based on that zero-displacement point and the set of selected displacement distances along the fiducial. Since this is a visual and manual procedure, we repeat it at least three times to determine the 1σ uncertainties. As our measurements of the filament's position from its original location are seen against the disk, we use the term "displacement" rather than "height" when describing its motion. Further below we discuss observations from the STEREO spacecraft, which add an additional dimension to our perspective. In this eruption, the filament motion that is easiest to track from the start and which shows the most explosive motion during the eruption is initially near where the brightening begins at the southern base of the filament, and so we select our fiducial to start near that location and to "map out" the trajectory of the part of the filament originating at that location. Also in this eruption, the location of the filament that we track shows two distinct motions: one is a bulging out of the filament or flux rope around the time of the initial brightening, and this motion is approximately normal to the axis of the filament; that is, it extends to the northeast in the AIA images. The second distinct motion occurs later, from 16:34:07 UT, with the filament detaching from the solar surface and moving largely toward the north in the AIA images. As the filament has two distinct phases to its motion, our selected fiducial has two components, the first extending toward the northeast, and then a more vertical component directed to the north. We show this two-component fiducial in Figure 2(b). The velocity of the filament, also plotted in Figure 4(a), is from taking the time derivative of the trajectory curve. As can be seen from Figure 4(a) and from the videos corresponding to Figures 2 and 3, the filament expands and moves outward with an initial hump in the velocity profile that peaks at about 16:12 UT. After a relatively slow rise, there is another jump in velocity beginning around 16:27 UT, followed by a still faster eruption starting about 16:34 UT.

Figure 4. (a) The trajectory labeled "Filament" is distance traversed by the filament in the plane of the image as a function of time, measured from 193 Å images along the fiducial line of Figure 2(b). Error bars are 1σ uncertainties obtained by three repeated measurements of the displacements. The filament velocity is the derivative of the displacement curve smoothed over 10 pixels and 10 time steps (∼4 minutes), with the dashed line showing zero velocity, and with 1σ uncertainties given for selected times. All distances and velocities for the filament are relative to the location of the end of the fiducial nearest the filament's start location, i.e., the end of the fiducial nearest the lower arrow in Figure 2(b). (b) Light curves from GOES (Figure 1, 1–8 Å channel), and for summed intensities over the box region of Figure 3(b) for AIA 304, 335, 94, and 131 Å channels, and for the XRT Ti Poly filter.
Download figure:
Standard image High-resolution imageIn Figure 4(b), we show light curves from the AIA images and from the XRT Ti Poly channel; these are all from the spatially integrated region of the box shown in Figure 3(b). We also reproduce a portion of the 1–8 Å GOES light curve from Figure 1, showing the episode 1 and 2 brightenings. We only include a subset of the AIA channels in these light curves; those from the remaining coronal-emission channels 171 Å, 193 Å, and 211 Å all showed substantial saturation at times in the images and hence we omitted their light curves; qualitatively, however, their time behavior was similar to that of the channels shown. All of the AIA channels show peaks roughly corresponding to the episodes 1 and 2 peaks of the GOES curve. Because the jump in velocity at 16:27 UT is early in the fast rise of the episode 2 emission, and because the filament proceeds to escape, we take the jump in velocity to be the start of the fast-rise phase of the filament's ejective eruption. The episode 1 emission starts early in the acceleration period of the filament trajectory during the trajectory's slow-rise phase. Thus, although the relative size of the emission is different, the episode 1 burst has a role analogous to "microflares" of our previous studies (e.g., Sterling & Moore 2005; Sterling et al. 2007a, 2007b, 2011a), as far as their relationship to the filament slow-rise motions prior to rapid eruption.
3.2. Closeup of the Dynamic Eruption Onset
We see from the above that the first filament eruption, the cascade eruption of the second filament, and the subsequent eruption and evolution of the entire large-scale eruption of the overall magnetic system all begin with an initial brightening at the southern base of the first filament, which was rooted at the south end of the magnetic neutral line of the active region. What happens there initially? To investigate this, we examine that region more closely near eruption-onset time.
Figure 5 shows a closeup of this location from the AIA 304 Å and 335 Å channels. We also inspected other AIA channels, but they add nothing more than what is apparent in these channels. In Figure 5(a), prior to onset, two strands of absorbing material are close together and appear to have weak curves to their shape. It is, however, just beyond the AIA resolution to determine definitively their nature. By Figure 5(b), there is weak brightening between these two strands, and they are closer together, being either partially merged or twisted but following along a cylindrical shape. By Figure 5(c), there is an unmistakable twist appearance of these structures, and this continues in various stages through Figures 5(d) and 5(e). In Figure 5(f), the twist has evolved into a writhe of the previously cylindrical feature. Thus it appears as if a magnetic flux tube has formed via reconnection of flux elements, and writhes under the influence of an MHD kink instability.

Figure 5. Closeup of the location where dynamic movement and brightening of the eruption begin in AIA images. In (a) arrows indicate two strands of material that appear to be slightly separated, and then merge or cross in (b), where brightenings start in the in-between region. In (c)–(e) this evolves into a cylindrical-shaped, twisted-appearing structure. By (f), the cylindrical structure has writhed into a kinked structure, also visible in Figures 2 and 3. All panels save (d) and (e) show AIA 304 Å images; panels (d) and (e) are from the AIA 335 Å channel, as around that time the location showed some saturation in the AIA 304 Å images.(Animations (a and b) of this figure are available in the online journal.)
Download figure:
Standard image High-resolution imageThe videos accompanying Figure 5 show that the initial cylinder may form twists at the start via field merging, over 15:48:32 UT–16:05:32 UT; that is, over a period of 15–20 minutes. Alternatively, the twists may have been previously present, but much more compact (that is, in a smaller-diameter cross-section cylinder, specifically, ≲ 5''). This cylinder then either unwinds or just expands radially (undergoes "inflation"), together with a massive increase in brightening in what appears to be along its interior in the axial direction of the cylinder, between about 16:05:32 and about 16:15 UT, at which time the flux tube starts to have nonzero writhe and therefore is no longer purely cylindrical. The radial expansion of the cylinder corresponds to the first jump in the filament displacement of Figure 4(a), and shows that the most rapid displacement corresponds to the apparent unwinding or expansion, while the more gradual, plateau-like filament rise between ∼16:17 and ∼16:27 UT corresponds to the writhing and pre-detachment phase of the filament. As mentioned above, the detachment and onset of the fast-rise phase of the first filament then corresponds to the second brightening episode of Figure 1, and the eruption of the second filament corresponds to the third brightening episode.
EIS observed the eruption region shortly prior to the spacecraft night. Figure 6(a) shows the intensity of the Fe xii 195 Å line, overlaid with intensity contours of the same. Figure 6(b) shows the same contour, overlaid onto a Doppler velocity map of the Fe xii line. There are two prominent line-shifted vertical strips near the center of the image, a mainly blueshifted strip to the east and a mainly redshifted strip to the west. The base region located at the south end of the east vertical strip is redshifted. Figure 6(a) shows that eastern strip is high intensity, while the west strip is low intensity. For these 195 Å EIS data we found the strongest of the blueshifts of the east strip to be 23 ± 17 km s−1, and the strongest redshifts at the southern portion of this strip to be 85 ± 60 km s−1. The redshifts in the west vertical strip are 62 ± 25 km s−1. Figure 6(c) shows non-thermal line broadenings, that is, line broadenings in excess of those expected from thermal and instrumental broadenings alone (e.g., Harra et al. 2009). Both of the vertical-strip regions show substantial non-thermal broadenings, with the strongest such broadenings at the base of the eastern strip. Using the same procedure as that of Harra et al. (2009), we find non-thermal velocity values corresponding to these broadenings of ∼70 km s−1 for the bulk of the two vertical-strip regions, with the strongest broadening near the south end of the eastern strip having a higher value of ∼125 km s−1. This maximum value for our determined non-thermal velocity is similar to the maximum-observed non-thermal velocities found by Kay et al. (2006) in soft X-ray He-like sulfur flare spectra of GOES C- and M-class flares. Our non-thermal line-width determinations assume a single-Gaussian fit to the line profiles, and so our derived non-thermal velocities may be artificially enhanced as some of our profiles appear to be somewhat asymmetric; it is not clear, however, whether similar effects affect the Kay et al. (2006) measurements. We used spectral line information from Young et al. (2007) for the EIS spectral line formation temperatures and other properties, and we used procedures discussed in Kamio et al. (2010) for determining the zero-velocity EIS Doppler shifts.

Figure 6. (a) Intensity image from the Fe xii 195 Å channel of Hinode/EIS, showing the region around that of Figure 5 near the time of the episode 1 brightening of Figure 1. Contours from the same image are overlaid to show the intensity structures in the other panels. (b) Contours of (a) overlaid onto a Doppler map of the same region, with red and blue representing motions away from and toward the observer, respectively. Magnitudes of the velocities are as described in the text. (c) Contours of (a) overlaid onto a non-thermal width map of the same EIS data. Magnitudes of the corresponding non-thermal velocities are as described in the text. (d) Contours of (a) overlaid onto an SDO/AIA 335 Å image, estimated to be close to the time the EIS spectral image was created; the time at the top of panels (a)–(c) being that of when the raster started, and the spectrum of the brightest intensity feature in (a) being about 88 s following the start of the raster.
Download figure:
Standard image High-resolution imageFigure 6(d) shows the EIS intensity contours on an AIA 335 Å image. We estimate that the EIS spectrum for the brightest intensity strip in Figure 6(a) was 88 s after the start of the raster scan, which places it at 16:13:36 UT, and so the AIA and EIS spectral information of the flux tube of Figure 6(d) are very close in time. We have adjusted the final alignment manually until the EIS intensity contours showed a good match to the AIA intensities; based on the respective intensities, the alignment should be good to about one-half the EIS x-direction resolution, or ∼3''. This overlay shows that the eastern vertical stripe in the EIS image coincides closely with our flux tube. This estimated accuracy in alignment suggests that the EIS blueshift and redshift are not due to the spinning of the flux tube, as at the time of the raster the appearance in the AIA 335 Å images (the flux tube being saturated in the 304 Å images at this time) suggests that the rotation is upward on the west side of the tube and downward on the east at least over the period 16:09:39 UT–16:14:51 UT. This is opposite to what the EIS line shifts would suggest at 16:13:36 UT if they represented the spinning tube. (The AIA images suggest flows moving upward on the east and downward on the west over the period after 16:14:51 UT until about 16:28:51 UT, but this is after the time of the EIS spectral data.) Instead, from the alignment, most of the flux tube is blueshifted in the EIS spectra, suggesting that it is being ejected at some tens km s−1. Thus the rotation suggested by the AIA movies either is not being resolved by EIS, and/or that rotation is not very fast at the precise time of the EIS spectral imaging. The southern side of the flux tube shows as bright emission in the 335 Å image, and coincides with the strongly redshifted base of the EIS eastern strip. The largely redshifted western EIS vertical strip seems to be from a location just off to the west side of the flux tube in the AIA image. Our interpretation is that this western strip is observing features beneath the flux rope, and we expect that this is the location of newly formed closed coronal flare loops.
We can consider further whether the redshifts are from incipient flare loops by overlaying the EIS intensity contours onto imaging data from hot ions, and HMI magnetogram data. Figure 7 shows these contours on AIA 94 Å Fe xviii images, which are most sensitive to flaring emissions (log T ∼ 6.8 K). Early on, there is strong brightenings south of the flux tube, where the strong redshifts occur, as shown in Figure 7(a). These brightenings are also apparent in the 335 Å video corresponding to Figure 5, over 16:12:51 UT–16:14:03 UT. These loops extend to the location of the intruding positive polarity region, and so that magnetic feature likely played a role in formation of strong "flare-like loops" (not distinguishing at the moment between the terms "flare" and "microflare" or "preflare") at this location. Then, a few minutes later, in Figure 7(b), the AIA 94 Å data show a "flare-like loop" at the location of the strong redshifts just to the west of the blueshifted flux tube location. The 335 Å video of Figure 5 shows this loop system over about 16:18:27 UT–16:26:27 UT. From Figure 7(b), this loop system resides above the main neutral line of the active region. Thus, the two strong redshift regions of Figure 6(b), that is, the vertical strip west of the flux tube and the region south of the flux tube, appear to be independent from one another and to both occur on or around respective neutral lines. Furthermore, in both cases, the imaging data suggest that flare loops exits at those locations at about the time of our EIS spectral observations.

Figure 7. EIS intensity contours of Figure 6, overlaid onto AIA 94 Å images, which detect hot flaring plasmas (Fe xviii, log T = 6.8 K). Panel (a) shows emission (arrow) from the base of the forming flux tube, which appears strongly redshifted in Figure 6(b); this region is magnetically connected to the intruding flux (see the text). Panel (b) shows a later time, when a bright loop (arrows) forms at a location likely beneath the erupting flux tube, and along the main neutral line of the region.
Download figure:
Standard image High-resolution imageWith the connection between the redshifts in the two locations and flare loops or brightenings established, we can consider the likely cause of the redshifts. Four possibilities are: (1) downflowing material in cooling flare loops, (2) postflare-reconnection loops shrinking to a smaller size (e.g., Savage et al. 2012), (3) compression of the lower atmospheric regions resulting from high pressure in the flare loops, and (4) "coronal implosion" in the reconnection region during the eruption (Hudson 2000). Possibility (1) might be viable for the southern brightening, since the transient flare-like loops in that region start at or before 16:12:51 UT, which is prior to the time of the spectral data of 16:13:36 UT; it seems less likely, however, for the west-side redshifts, where the loops start at about 16:18:27 UT in AIA 335 Å images (and from about 16:15:20 Å in AIA 94 Å images), since those times are after the spectral line shifts appear. For (2), Reeves et al. (2008) found some such loops to shrink with a velocity of ∼50 km s−1, similar to what we find in the EIS redshifts. Also, Sui & Holman (2003) found downward moving flare loops shortly after onset of their eruption, although the velocities they found (∼9 km s−1) were somewhat less than our median redshift values; similar velocities were found in radio observations by Li & Gan (2005). In our case, however, we cannot detect obvious downward-moving loops in the AIA videos of Figure 5. For (3), the velocities due to compression observed by Graham et al. (2011) tend to be ∼10 km s−1, which is again lower than velocities than we find here. Milligan & Dennis (2009), however, find redshifts of few × 10 km s−1 from this process, and this is consistent with values we find; they also find a decreasing redshift velocity as temperature increases. For possibility (4), coronal implosion could lead to loop contraction at large velocities; Liu & Wang (2009), for example, find velocities of ∼100 km s−1 that they attribute to this process. As with possibility (2), however, we do not identify such loop motions in the AIA movies. For both of these possibilities (2 and 4), the loop motions may not be apparent in the AIA movies due to the poor visibility from the perspective with which we are observing. Also, for the southern redshifted region, the loops may be too small for us to see clearly in these images. Failing this, possibility (3), the high-pressure chromospheric compression, might be the most likely possibility to explain our observed EIS spectral redshifts.
In regard to possibility (3), we can investigate the temperature dependence of the redshifted velocities of possibility (3) found by Milligan & Dennis (2009). Specifically, they found a velocity dependence of vred ≈ 60–17T, where vred is the downward-directed velocity in km s−1, and T is the temperature in MK; they found this relation to hold over several spectral lines with formation temperatures spanning 0.5–1.5 MK. We attempt to check this by looking at Doppler line shifts in other EIS spectral lines in addition to Fe xii. Figure 8 shows our measured velocities over six difference EIS channels; these are for the strong redshifted feature south of the flux rope only. There could be a possible trend for the redshifts to be stronger in the cooler lines, which would be consistent with the Milligan & Dennis (2009) results, but this is not definitive due to uncertainties in the measurements. Similarly, measured Doppler line redshifts from the vertical strip to the west of the flux rope, showed no conclusive trends with temperature, considering the uncertainties. (Also, incidentally, there was no such trend in the blue shifts in the flux rope region either.) Our uncertainties, however, are large; they are derived by considering the apparent variation of the spectral-line peak location within a relatively small region (few arcseconds in the N-S direction) over which we inspect the spectra, and also estimating visually how accurately the single-Gaussians we use actually fit the spectral data (some spectra are asymmetric, or very complex, suggesting the possibility of multiple overlapping spectral components to the emissions). Similarly, there are uncertainties when estimating the location of the spectral line peak for the zero-velocity locations in the data. Without deeper spectral analysis, along with additional assumptions (such as multiple spectral components), we do not believe that we can say with any more confidence the values for the measured line shifts than those expressed by the error bars in Figure 8. In summary, our EIS Doppler information shows blueshifts consistent with the expulsion of our suspected flux tube. These Doppler results also show redshifts that come from flare loop-like regions and whose source is possibly consistent with high-pressure compression of the chromosphere; this source of the redshifts is still not certain, however, and is less conclusive than the erupting flux tube being the source of the blueshifts.

Figure 8. Doppler velocities from the strongly redshifted region immediately south of the vertical blueshifted stripe region in Figure 6(b) (x = −310, y ∼ −343–−347), as measured in six different EIS channels. The channels are represented by the temperatures along the abscissa, with the ions and log temperatures being: O v 248 Å, 5.4; Fe x 184 Å, 6.0; Fe xii 195 Å, 6.1; Fe xiv 264 Å, 6.3 (plotted shifted slight lower); Fe xv 284 Å, 6.3 (plotted shifted slightly higher); Fe xvi 262 Å, 6.4. Error bars are from the uncertainties in identifying the location of the peaks of the Gaussians fitted to both the shifted components and to the apparent background.
Download figure:
Standard image High-resolution imageWe can consider these early-time eruption activities from the vantage point of the STEREO-B satellite, which observed the eruption as a near-limb event. We examined the STEREO-B/EUVI images to see whether some motions may coincide with the EIS Doppler shifts. Those images show the filament more distinctly than AIA saw looking at the features against the solar disk. They also indeed show outward motion of the filament corresponding to the first GOES-episode brightening, as shown in Figure 9. We estimated the velocity of the outward-moving filament using EUVI images at 16:05:54 UT, 16:10:54 UT, and 16:13:24 UT, and found it to be 15 ± 5 km s−1. This is also comparable to velocities we measured from the on-disk perspective of AIA (Figure 4(a)). These velocity values are somewhat lower than our maximum blueshift velocities in the EIS eastern strip, which again likely corresponds to the flux rope, but other locations on the eastern strip show lower velocities. Moreover, both SECCHI and AIA may have been observing with a perspective non-normal to their respective lines of sight with the outward-moving feature. Overall the EIS, AIA, and STEREO-B results are consistent with outward movement of some tens of km s−1 for the flux rope over this time period.

Figure 9. Images from the 195 Å channel of STEREO-B, SECCHI/EUVI, in which the eruption occurs near the west limb. There is upward movement of a thin filament over the time spanning panels (a) and (b), and continuing though panel (c). The arrows in (a) and (b) and the two southernmost arrows in (c) point to the filament. The northernmost arrow in (c) shows a transient brightening that appears to correspond to the location where we suspect writhing of the flux tube from the AIA images; it corresponds to the bright region near (−310, −300) in Figure 5(f).(An animation of this figure is available in the online journal.)
Download figure:
Standard image High-resolution imageAlso in the STEREO-B/EUVI images, we can examine the apparent writhing of the flux tube that we identified in the AIA images. The northernmost arrow in Figure 9(c) points to the bright seemingly writhed AIA bright feature. That bright feature corresponds to the bright, saturated feature near the middle top of the AIA 304 Å image of Figure 5(f). This feature can be seen unsaturated in the AIA 335 Å movie accompanying Figure 5, for example, at 16:15:15 UT and 16:19:19 UT, as well as other times. It is not possible to verify that the feature is undergoing writhing in the STEREO-B EUVI images due to the lower spatial resolution of EUVI, and also possibly due to the writing occurring approximately along the line of sight of the STEREO-B satellite. There is, however, nothing inconsistent with our writhing interpretation apparent in the STEREO/EUVI images.
Assuming that we are seeing the formation of that flux rope over ∼15:48:32–16:05:32 UT, we can ask how much non-potential magnetic energy is available to be unleashed in the system as the flux rope is formed. In particular, we can ask whether reconnection and twist injection in this region alone power the entire eruption. We can estimate the amount of free (i.e., non-potential) energy that the filament flux rope field contains; it is this free energy that would contribute to the explosion of the field. The presumed flux rope of Figures 5(c)–(e) has twists that are roughly at a 45° angle to the flux rope's central axis. This means that the axial and azimuthal components of the field in the flux rope are roughly equal in strength and hence have roughly equal energy. Most of the energy in both components is free energy that can be released by the expansion of the flux rope as it erupts (e.g., Moore 1988; Moore & Sterling 2006). Thus, for a conservative estimate of the free magnetic energy in the flux rope, we can just consider what the amount of axial magnetic field energy, Ez, might be. After Moore (1988), this would be given by
where Bz, r, and L are, respectively, the magnetic field strength in the axial direction of the flux tube, the radius of the flux tube, and the length of the affected portion (that is, the portion undergoing the twisting) of the flux tube. From Figure 5, we can estimate r and L to be ∼3'' and 50'', respectively, at the time of Figure 5(c). We do not know what Bz is with much accuracy, but the HMI magnetograms in the neighborhood of the southern portion of the neutral line of the region have values of several hundred G, and so 100 G should be of order of the strength of the field along the flux tube axis, Bz, at the time of Figure 5(c), which is shortly after the flux tube's formation. These numbers give
This is our order-of-magnitude estimate of the amount of free energy in the filament flux rope. This is substantially larger than a quiet-Sun microflare energy of ∼1026 erg (e.g., Krucker & Benz 2000). A very weak flare (GOES mid-B level) might have energy of 1028–1029 erg (Sterling & Moore 2003), and so this C-class event is likely of energy ≳ 1030 erg.
We have estimated the total soft X-ray radiated energy of the full event over about 16:10 UT–19:00 UT, using the intensities in the two GOES channels. From these intensities we can determine electron temperature and emission measure of the background-subtracted flaring plasmas via Thomas et al. (1985), and then using this output in the Mewe (Mewe et al. 1985) model spectrum gives the radiated power, which upon integration gives the desired energy estimate. From this we find energies of ∼9 × 1029 erg for the GOES X-ray radiated energy. Saint-Hilaire (2005) found somewhat similar values for three GOES C-class flares they observed, with values ranging from (0.2–2.3) × 1030 erg. Based on our estimate, it is likely that a twisted flux rope suggested by Figure 5 could only supply a portion of the entire energy output of the eruption. The remainder of the energy would come from: the remainder of the pre-eruption structure, be it a flux tube or just a sheared region along the remainder of the neutral line, that would not have taken part in the initial reconnection that creates the feature of Figure 5; from overlying field that also might contain a substantial non-potential component and that becomes disturbed and released by the eruption of the first filament; and from the energy released from the field in the eruption of the second filament, which would necessarily also contain shear for the filament itself to exist. Therefore, the initial twisted flux tube of Figure 5 would indeed be a trigger for the more-complete eruption, and that in itself comprises only a small fraction of the total energy released in the eruption; this is the way solar eruptions are typically believed to occur (e.g., Klimchuk 2001).
3.3. Magnetic Environment
We can investigate what might have triggered the dynamics pictures in Figure 5. That is, assuming that figure is showing formation of a flux rope via reconnection of individual non-potential flux strands, what in the surrounding magnetic environment could have instigated the reconnection at that location?
Figure 10 shows line-of-sight magnetograms from HMI (Figure 10(a)), and from the SOT Na i D1 5896 Å line (Figures 10(b)–7(d)) of the region near the time of eruption. Figure 11 shows an HMI magnetogram on an AIA 304 Å image in Figure 11(c) at the time when the twisted flux-rope-like feature is present, and on an XRT Ti Poly image in Figure 11(d); the XRT image is the earliest that shows substantial brightening at the location of the eruption (the previous image we inspected being at 16:04:26 UT). We estimate the accuracy of the alignment to be ≲ 5''.

Figure 10. Line-of-sight magnetic field, with white (black) representing positive (negative) polarities, from (a) SDO/HMI and (b–d) Hinode/SOT. The boxed region in (a) shows an "intruding positive polarity" feature, that is mainly positive polarity in a sea of surrounding negative polarity. The long arrows in (b), (c), and (d) point to the main neutral line along with the eruption took place; the panels show a progression of small-scale changes of flux along this neutral line. The short arrow in (d) points to a neutral line adjacent to the main one, and where flux changes occur between (b), (c), and (d). Cancellation along the main neutral line, flux dynamics of the intruding polarity, changes at the neutral line of the short arrow in (d), or perhaps some other factor or combination of factors could have led to the eruption along the main neutral line.
Download figure:
Standard image High-resolution image
Figure 11. (a) An HMI magnetogram of the eruption region, at a slightly later time and with a slightly larger field of view than the one of Figure 10(a). (b) The magnetogram of (a), with contours of the same at 40, 70, and 750 G. (c) The contours of (b) overlaid onto the AIA 304 Å image of Figure 5(c), showing the twisted-flux-tube-like feature during the incipient stage of the eruption. The arrow points to the location of a compact, transient brightening seen in SOT Ca ii images over about 15:43–16:00 UT, that may be weak flare-like ribbons from reconnection of the field lines creating the twisted flux rope (see Figure 12). (d) The same contours overlaid onto an XRT Ti Poly image that shows brightenings near the time of the AIA 304 Å structure of (c). Arrows in 11(a) are sample locations where flux cancellation could have helped trigger the eruption; see Section 3.3 of the text.
Download figure:
Standard image High-resolution imageBy comparing with Figure 11, we see that the eruption itself took place on the main neutral line indicated by the long arrows in Figures 10(b)–(d). The images in Figure 10, as well as the movies we have inspected of these magnetograms, suggest that flux cancellation took place along this main neutral line in the hours prior to eruption. This cancellation could be what led to the apparent merging of the filamentary strands in Figure 5(a), and the eventual eruption onset. The arrow in Figure 11(c) shows a location where we see a compact (≲ 10''), transient brightening in Hinode/SOT Ca ii images from about between 15:43 UT to about 16:00 UT. Figure 12, and the accompanying video, shows these Ca ii images, with an SOT magnetogram overlaid. From 16:01 UT we see in those Ca ii images a filament-like feature emanating from the main neutral line, including the location of the transient brightening. The transient Ca ii brightening could be mini-flare ribbons resulting from processes that built or inflated the twisted flux rope, although we cannot rule out that this transient brightening is a Ca ii manifestation of the flux rope itself. In any case, the onset of the filament-like motions away from the main neutral line start within minutes of the disappearance of the transient brightening, consistent with the transient brightening resulting from reconnection that triggered the slow-rise onset.
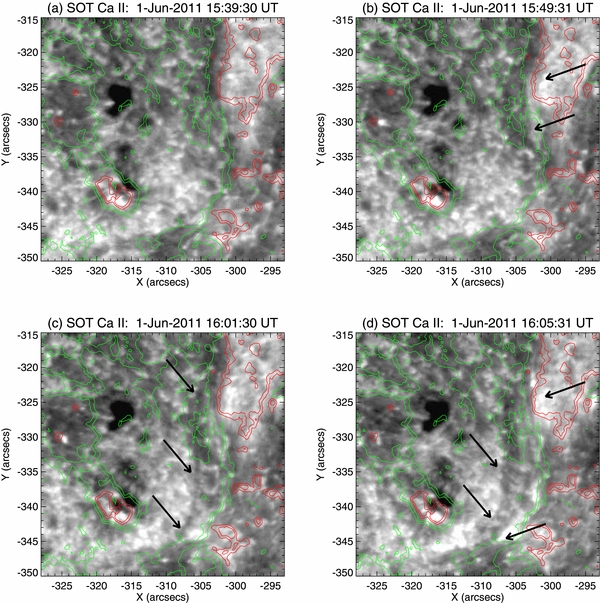
Figure 12. (a) SOT Ca ii images of the region around where the flux rope forms (cf. Figure 5), with the SOT magnetogram from 2011 June 1 15:59:35 UT overlaid, where the contours are at 40, 100, 400, and 750 G, with alignment estimated to be accurate to ∼2''. The arrows in (b) show where subtle transient brightenings in Ca ii occur since the time of (a); this location is near the arrow of Figure 10(c), which can be verified by comparing locations on the respective magnetograms. After this transient brightening fades, a filament-like feature, indicated by the right-pointing arrows in (c) and (d), is visible moving away from the main neutral line.(An animation of this figure is available in the online journal.)
Download figure:
Standard image High-resolution imageIn Section 3.2 we presented two ideas for the processes for the flux rope, one being field merging that would have created the flux rope, and the other being an inflation of a pre-existing flux rope. Field merging of the form suggested by the perspective of Figure 5(a) would be essentially the tether-cutting picture. If instead the flux tube is pre-existing and undergoes an inflation or expansion, then something would have to be responsible for triggering this expansion. Although speculative, we believe this would also have to involve some sort of magnetic reconnection, since it would be necessary to have a change whereby the magnetic pressure of the flux tube becomes more dominant relative to the flux tube's tension, which we imagine would be a magnetic process. In addition to the canonical tether-cutting possibility, reconnection between the flux tube with emerging flux is also possible, or cancellation of some of the flux tube's field with nearby surrounding fields could be another mechanism inducing the changes resulting in flux tube expansion. We are unable to differentiate between these various possibilities with any confidence, as the size scale of the processes involved appear to be beyond the resolution of AIA (Figure 5(a)). Still another possibility is that the twisted structure could itself have emerged as a helical flux rope, and even possibly formed the filament via reconnection processes (Okamoto et al. 2008, 2009, 2010). Therefore, we regard any of these magnetic reconnection processes as viable possibilities for the formation of or the initial unleashing of the magnetic energy of the twisted flux tube.
The cancellation along the main neutral line could have led to the reconnection of the flux elements independent of other solar activity in the neighborhood. In Figure 10, the southern long arrow points to an interval of the neutral line under the filament at which opposite-polarity flux converges over the 3 hr between panels (b) and (c). This convergence may well have driven flux-cancellation tether cutting that built up the filament flux rope and destabilized it to erupt. Flux at the location of the short arrow in Figure 10(d) also undergoes dramatic changes in the hours before eruption, as can be seen in Figures 10(b)–(d); this is the location of transient EUV brightenings visible, e.g., in the videos accompanying Figures 2 and 3. Another possibility, however, is that some nearby activity assisted that reconnection and hence the subsequent eruption onset. One possibility for this is that the intruding polarity was the catalyst for the eruption onset, perhaps abetting cancellation along the main neutral line near the southern arrow of Figure 10(c). Figures 10(a) and (d) show HMI and SOT magnetograms, respectively, from approximately the same time, with the boxed region in Figure 10(a) outlining the intruding polarity. From the higher-resolution SOT magnetogram, it is immediately obvious that this intruding polarity feature is complex, with some negative flux also embedded inside of the positive. The feature itself is dynamic with time. We have measured the amount of positive flux contained in the box of Figure 10(a) around this region that includes no other obvious positive field. Figure 13 shows the flux variation with time summed over this box as measured in the HMI data. We find that, after rising for about 6 hr, the flux reaches a maximum between 7 UT and 8 UT on 2011 June 1, and then falls approximately monotonically for the next 8 hr. Using the same procedure with the SOT data instead gives a similar variation of the intruding polarity positive flux with time; here we show the HMI data since they are smoother and more continuous than the SOT data over this time period (due to Hinode spacecraft night periods and other factors). Therefore, the amount of net positive polarity is falling over the time of Figures 10(b)–(d). This flux reduction could be indicative of flux cancellation, and, somehow, interactions between the canceling fields and the field of the filament on the main neutral line could be responsible for the eruption onset. This is a suspicion because this eruption starts on the interval of main neutral line closest to this intruding polarity, and because similar intruding polarities have been suggested as the reason for eruption onset before, in the form of moving magnetic features (e.g., Zang & Wang 2002; Sterling et al. 2010), or perhaps flux emergence (e.g., Kuperus & van Tend 1981) if occurring in an otherwise largely unipolar location. Still, however, we cannot rule out that this intruding polarity may just happen to be near the location of the eruption's onset, without playing an important role in the start of the eruption.

Figure 13. Flux as a function of time of the "intruding polarity" region, the boxed positive flux region of Figure 10(a). Only the positive flux variation is plotted, as it is can be isolated within the boxed region over the measurement period while the negative flux flows in and out of the box boundaries. These measurements are from the SDO/HMI instrument. The solid line shows the summed flux values with the low-level cutoff of 100 G. The dashed curves are the same, but with cutoff values of 0 G (upper dashed curve) and 200 G (lower dashed curve), as one measure of uncertainty in the measurements. Although there are substantial changes in the flux level in the hours prior to the eruption, there is no definitive change at the time of eruption onset near 16 UT.
Download figure:
Standard image High-resolution imageThere are other possible agents that could have been important to the formation of the apparent flux rope in Figure 5. Flux at the location of the short arrow in Figure 10(d) also undergoes dramatic changes in the hours before eruption, as can be seen in Figures 10(b)–(d); this is the location of transient EUV brightening visible, e.g., in the videos accompanying Figures 2 and 3. Similar brightenings also appear at this location prior to the eruption in soft X-ray images from XRT, indicating that hot plasma is being produced by dynamics at that location. Flux cancellation at this site could have led to these dynamics (e.g., Kano et al. 2010) and also perhaps to tether-weakening episodes that abetted the later magnetic reconnection along the main neutral line that formed the twisted flux rope of Figure 5. In addition to this location, however, we can further identify at least three other locations where magnetic changes, in the form of cancellation with intruding opposite-polarity flux or cancellation among opposite-polarity flux systems, occurred around the time of the eruption onset. These three locations are indicated by the one arrowed region in Figure 2(a) and the two arrowed regions in Figure 11(a). Each of these locations is plausibly magnetically connected to the location where the flux rope forms, and therefore any or several of these magnetic activities could be catalysts for the flux rope formation. We do not present measurements of the flux changes in these regions, similar to Figure 13, because in these cases it is not as simple to isolate one or both polarities of the region over a long time period; that is, it is hard to select a box over which it is clear that there is little or no flux flowing across the boundary, and that is a necessary condition for determining reliable flux-change measurements.
We cannot say which of these candidates—among the intruding polarity and the four flux-cancellation sites pointed out in the previous paragraph—or indeed some other magnetic driver, working either alone or in conjunction, was the ultimate catalyst for the eventual apparent magnetic reconnection that led to the flux-rope formation followed by the large-scale eruption cascade. For this event, from these data and the current analysis, we conclude that we can trace the source of the eruption back to the formation of the flux rope of Figure 5. But we cannot say what specific solar activity led to the reconnection that made this flux rope.
4. DISCUSSION
We observed that the eruption of one filament on 2011 June 1 quickly led to a second filament eruption. There was a cascade of eruptions, explaining in part the multiple-peak structure of the GOES soft X-ray light curve of Figure 1. Examining the motions of the first filament, we find that its trajectory was similar to several others that we and others have mapped out before, in that there was a relatively slow displacement motion of the filament, its slow-rise phase, before its rapid eruption, its fast-rise phase. As we have seen several times now, the slow rise occurred in stages, with a more-rapid initial velocity (∼20 km s−1) near 16:15 UT, followed by a plateau in velocity (∼5 km s−1) from about 16:20 UT, and then again a more rapid stage (∼20 km s−1) from ∼16:27 UT in the onset of the fast-rise phase, and then speeding up to 50 km s−1 from about 16:35 UT. The initial period of relatively fast slow-rise velocity near 16:15 UT, and the start of the fast rise from about 16:27 UT, both coincide closely with the, respectively, episode 1 and episode 2 brightenings in the GOES light curves. Removal of a portion of the active region field by the first filament eruption allowed a second filament to erupt. Closeup inspection of the location where the initial brightenings occur when the first filament erupts shows that the filament becomes twisted at the time of that brightening, and that twist evolves to writhe (and/or "unwinds," perhaps via propagation further along the flux rope) as the eruption proceeds. We are not able to tell, however, what magnetic field evolution led to the reconnection that built the flux rope, although we have identified at least six different candidate possibilities: independently driven flux cancellation along the main neutral line, dynamics induced by the nearby intruding positive polarity feature, and flux motions and cancellation at one of four nearby external locations (indicated by the arrow in Figure 2(a), the short arrow in Figure 10(d), and the two arrows in Figure 11(a)).
The twist of the flux tube, both before and after the writhe, appears to be dextral (right handed). We cannot make out barbs of the filament itself, and so strictly speaking we cannot observe the chirality of the filament. The flux tube being dextral, however, suggests that the filament is likely sinistral, since sinistral filaments reside in magnetic field that has right-handed shear and twist (e.g., Martin 1998). Assuming that is the case here, then the chirality of this system agrees with what is found in most chromospheric filaments according to, e.g., Pevtsov et al. (2003), who found 85% of southern hemisphere filaments to be sinistral.
We can summarize the key progression of events with the help of the schematic in Figure 14. Figure 14(a) shows the situation prior to eruption onset, with two filaments arranged along the neutral line; we cannot discern the details of their respective placement, but we suspect it is as depicted here, with both arranged linearly along the length of the neutral line with perhaps some portions overlapping. Some sheared field, represented by green in the figure, lies below the first filament. This sheared field could be the lower product of slowly driven evolutionary tether-cutting reconnection that gradually built up the filament flux rope, that is, gradual reconnection low above the photosphere that occurred in sheared field that built up above the neutral line via photospheric flux cancellation at the neutral line (Moore & Roumeliotis 1992). (Here we are depicting the possibility that reconnection forms the flux rope, rather than a more-compact flux rope inflating.) Figure 14(b) shows the consequence of a rapid burst of further such tether-cutting reconnection of the legs of the sheared field enveloping the filament flux rope a la Moore et al. (2001), reconnection that was perhaps facilitated by the rising of the filament flux rope that this reconnection builds and unleashes. This reconnection gives the rising flux rope more twist. The rising of the twisted filament flux rope also disturbs some higher-arching adjacent loops, causing them to brighten (red loop in schematic). At about the same time there is excitation at the base region of the filament near the intruding polarity region. It is likely that the relatively strong field of the intruding polarity and surrounding areas became disturbed by the filament motions. Small-scale loops form in that region, and produce redshifted signatures in the EIS data, in the patch to the south of the blueshifted outward-arching flux tube. The twisted flux rope formed (or expanded) over ≲ 20 minutes, and then from about 16:13 UT, the twist evolved into writhe of the flux tube/filament. Figure 14(c) shows the situation during and just after the writhing. At this point, flare-like loops become visible in EUV over the neutral line below the filament, and these are likely the "lower product" of the reconnection that added twisted field to the filament flux rope above; these loops likely contain the redshifted plasma that we observed with EIS parallel to and just west of the erupting filament. The writhed flux rope/filament maintained a temporary quasi-equilibrium, corresponding to the relatively flat plateau in the filament's slow-rise profile. By 16:27 UT, that writhed flux rope itself became unstable enough to result in the first filament eruption; so initially only the southern portion of that filament forms a twisted flux rope that undergoes writhing, but when that portion of the filament becomes unstable the northern portion of the filament is pulled along as the whole filament erupts. Figure 14(d) shows this stage, where the first filament is starting to lift off, where it will subsequently travel northward and outward from the Sun. This eruption was accompanied by its own flare emission (episode 2 of Figure 1), where the corresponding flare loops are not yet visible in Figure 14(d). This eruption removed the field that held down the second filament, allowing its eruption. Large flare loops then resulted from the sequence of eruptions (episode 3 of Figure 1).

Figure 14. Schematic showing evolution of the two filament eruptions, where the darker brown feature represents the first-erupting filament and the lighter brown feature represents the second-erupting filament. Dotted lines show the main magnetic neutral line of the active region, and that surrounding the compact intruding positive polarity. (a) Prior to eruption onset, but with rapid tether-cutting reconnection about to commence below the filament field and above the green sheared field. (b) This tether-cutting reconnection both adds twisted field to the outside of the filament above it and adds new strands to the green sheared field below it. Also, a larger-scale coronal loop and small-scale loops connecting to the intruding polarity are excited and illuminated. (c) The twisted flux tube undergoes writhing, and at about the same time flare-like loops become visible along the neutral line. (d) The entire first filament becomes unstable and erupts. This process removes field lines restraining the second filament, which will subsequently erupt. The schematics can be compared with the actual eruption shown in the videos corresponding to Figures 2, 3, and 5; the schematic in panel (a) corresponds to the situation at approximately 16:10 UT in those videos. Similarly, the schematic in panel (b) corresponds to the situation in the videos over the approximate time range 16:11 UT–16:13 UT; that in (c) to the approximate time range 16:15 UT–16:20 UT, and that in (d) to the approximate time range 16:30 UT–16:35 UT.
Download figure:
Standard image High-resolution imageWe can further interpret the large-scale evolution by inspecting EUV images from STEREO/SECCHI EUVI, and white-light outer-corona images from the coronagraphs on STEREO and Solar and Heliospheric Observatory (SOHO). We show two STEREO-B EUVI 195 Å channel images in Figure 15, and the entire sequence of the eruption in the video accompanying that figure. That near-west-limb perspective from STEREO-B verifies that the first eruption traveled substantially northward, and in fact into a transequatorial loop, inflating that transequatorial loop (Figure 15(a)). The second eruption then blew out this transequatorial loop structure (Figure 15(b)). While fainter portions of that second eruption clearly erupt outward from the Sun, the precise long-term trajectory of the initially brightest portion of the second filament is hard to follow in the EUVI images, but it appears also to follow the fainter portions and also eject outward switching from a mainly horizontal trajectory to a mainly outward one (as seen from STEREO-B) over ∼17:10 UT–17:20 UT. These STEREO EUVI images confirm that the entire (or nearly entire) eruption slips out toward the north of the strong active region field. That transequatorial loop is then blown out and becomes a CME roughly symmetric around the equator visible in STEREO/COR1 and COR2 coronagraphs, and also in the SOHO/LASCO coronagraph; thus it is an example of an "over-and-out" CME eruption (Moore & Sterling 2007; Sterling et al. 2011b). Whether the first filament eruption alone would have completely ejected from the Sun or become confined in the large transequatorial loop is unclear. What did happen, however, is that the second eruption "caught up" to the first eruption, and the entire system erupted from the Sun as, essentially, a single CME; this is best seen in the video accompanying Figure 15. The LASCO running difference movies show the CME to have complex structure, and these complexities may reflect the double-filament-eruption genesis of the CME.

Figure 15. Images from the 195 Å channel of STEREO-B, SECCHI/EUVI, in which the eruption occurs near the west limb. In these images, the active region that appears in the AIA figures and in which the eruption occurs is in the south. (a) The arrow points to material being ejected from the first filament eruption. (b) The three westernmost arrows point to an expanding shell that accompanies (mainly) the first filament eruption at this time. The easternmost arrow points to material being ejected with the second filament eruption; at this time the material closely hugs the solar surface, but at later times it arches upward and heads away from the Sun, roughly following or joining with the material from the first filament eruption.(An animation of this figure is available in the online journal.)
Download figure:
Standard image High-resolution image
From the movie accompanying Figure 15, we can see that the combined liftoff of the two erupting filaments results in flare-loop brightening primarily in the northern portion of the source active region, although other locations also brighten in addition. These northern active region bright loops are those pointed to in Figures 2(f) and 3(f). Since the CME leaves from a more equatorial latitude, well north of the active region in which the strong flaring occurs, this is an example of flare brightening occurring displaced off toward one leg of a CME, an issue we explored in detail in Sterling et al. (2011b). The brightest flare loops occur in the active region instead of directly "beneath" the erupting CME (that is, the centroid of the CME projected back onto the solar surface), because the magnetic field is much stronger in the active region. At least in the EUVI 195 Å images of the Figure 15 video, and in full-disk AIA 171 Å images we have examined, weaker-intensity flare ribbon-like structures are apparent running to the north of the active region as the filament eruptions proceed northward from the active region and then outward away from the Sun.
This event is similar in some aspects to our first-studied SDO filament eruption (Sterling et al. 2011a). At the time of that filament's slow-rise start, there was a microflare brightening, and also onset of filament spinning-type motions or distortion into a twisted field. After a plateau in the rise profile, that filament then appeared to writhe and start its fast eruption, although that rise was halted as that eruption was of the confined variety. In that case, a helical "cocoon" of bright EUV emission surrounded the filament, particularly distinct around the time the fast eruption started. We also see an increase in EUV emission in our 2011 June 1 event here, as evident in Figures 2(b)–(d) and Figures 3(b)–(d). Moreover, that EUV emission takes on a corkscrew type of evolution (see videos accompanying Figures 2 and 3), and therefore is helical in shape. A difference though is that in this case the filament is much less distinct than in the Sterling et al. (2011a) event, and so the EUV emission of the event discussed here does not obviously surround cool filament material as it appeared to do in the Sterling et al. (2011a) case. Also, in Section 1 we pointed out how that Sterling et al. (2011a) event displayed two aspects that might be at odds with tether cutting being the trigger for the eruption onset and with the standard flare model: early brightenings above the filament, and the initial flare loops seeming to form from an arcade field orthogonal to the neutral line. In the present event, we do not notice the initial brightenings (episode 1 of Figure 1) to occur at an unexpected location; we expect these brightenings to be due to tether-cutting reconnection below the rising filament, tether-cutting reconnection that may have been induced to start by flux cancellation at the neutral line under the filament or at other neutral lines. Similarly, we do not identify features at odds with the standard flare model picture in this event, as we discuss below. That being said, our viewing perspective of this event with high-resolution AIA images is quite different from that of the Sterling et al. (2011a) study, and we may not be able to observe the exact same analogous phenomena in both events even if they are present. Thus, a definitive discussion of the possible non-standard-eruption aspects reported in that previous study will have to await examination of many more events.
Merging of field lines prior to eruption is a fundamental aspect of the tether-cutting picture for eruptions discussed in the Section 1. The apparent merging of field has been hinted at or seen before in soft X-rays, in the formation of "sigmoids" prior to eruption (Rust & Kumar 1996; Pevtsov 2002; Sterling et al. 2007b; McKenzie & Canfield 2008; Green & Kliem 2009; Green et al. 2011), where two J-shaped structures are sometimes seen joining into the sigmoid S shape. In Figure 5, we may be seeing here a similar process occurring at cooler coronal temperatures, whereby two partially twisted features (presumably strands of magnetic field carrying filament-temperature material) merge to form a twisted magnetic flux rope, via tether-cutting reconnection. As mentioned earlier, however, in this case the evidence for tether cutting is not definitive, as the apparent flux-tube-strand separation and merger is very near the limit of the AIA resolution; we cannot distinguish tether-cutting reconnection from the possibility of expansion of a narrow twisted flux rope formed via flux cancellation at the photospheric neutral line under the filament. Whatever the process, in this case it does not itself lead directly to the eruption. Rather, apparently, the likely magnetic reconnection results in a twisted flux rope (or an inflated twisted flux rope) that then become susceptible to MHD kink instability. The other observed flux cancellations, away from the neutral line under the filament, could also have led to tether cutting below the filament (e.g., Martin et al. 1985). We are not, however, able to connect definitively any of the small-scale flux changes that we see with the tether cutting that probably formed the flux rope for this event.
Many other works discuss twist and twist-induced instability in filament eruptions (e.g., Török & Kliem 2005; Fan & Gibson 2007; Gilbert et al. 2007), and present observational examples (e.g., van Driel-Gesztelyi et al. 2000). Quite early on, for example, Sakurai (1976) talked of the kinking of slow-rising filaments leading to their eruption, just as we observe here. Srivastava et al. (2010) observed flux tube kinking in a small flare eruption they observed with Transition Region and Coronal Explorer (TRACE) and Hinode. They observe a twist of at least 6.0π radians in their flux rope, and estimate that the total amount of twist may be twice that value, far exceeding the kink instability threshold of 2.5π radians for line-tied loops (Hood & Priest 1979), or that of 3.5π radians from the work of Titov & Démoulin (1999); this value, however, depends on loop parameters (e.g., Török et al. 2004). From our Figure 5, there appear to be at least 3.0π radians (1.5 turns) of twist over ∼50'' distance, and so the twist in our suspected flux tube is apparently in the range of the theoretical values for the instability threshold.
We can now revisit the topics broached in Section 1 regarding the questions of tether-cutting reconnection, and the status of the standard flare model, based on our observations of this event. For the episode 1 brightening, the data are consistent with tether-cutting reconnection occurring at the location of the arrows of Figure 10(b), since we observed the flux-rope-type twisted structure forming at that location. If it indeed is due to tether cutting, then formation of field lines that twist around the filament is just what would be expected from tether-cutting reconnection, as discussed in Section 1. There are several possible locations where tether-weakening reconnection may have occurred to induce the reconnection responsible for formation of the unstable flux rope, as discussed in Section 3.3, but we are not able to confirm these possible connections. Either the flux-rope formation process, or the subsequent upward movement of a previously formed flux rope, led to flare ribbons, apparent in Figure 2(c), and hot X-ray emissions of Figure 1 episode 1 from flaring loops (see videos accompanying Figures 2 and 3); this is in agreement with the standard flare model. Episode 2 of Figure 1 occurred when the filament and coronal loop system disrupted by episode 1 became unstable enough to erupt away. Therefore this filament eruption itself was probably not directly triggered by tether cutting (or similar reconnection processes), but the erupting filament did lead to flare loops that can been seen in the videos accompanying Figures 2 and 3, occurring toward the southern end of the erupting filament flux rope, at the location bright in Figure 2(d). These flare loops would be caused by runaway tether cutting that recloses the legs of the field enveloping the escaping flux rope, as in the standard model. Episode 3 of Figure 1 occurs when the filament on the northern end of the neutral line becomes free to erupt following the first filament eruption, apparently via removal of previously restraining field by the first eruption.
Finally, one may ask whether the peaks in the GOES curve for Figure 1 really represent only one flare, or three separate flares. This may be a question of semantics: as we have noted in Section 1, precursor brightenings are frequently seen in eruptions. These precursors often appear as relatively small bumps in the lower-energy GOES curve compared to the size of the main flare peak (e.g., Harrison 1986). Whether the first two episodes of Figure 1 are best thought of as the same type of precursors that happen to be relatively large, or whether their relative largeness reflects a special character of this event, is something that can be re-addressed as more events are studied from this standpoint.
A.C.S. and R.L.M. were supported by funding from NASA's Office of Space Science through the Solar Physics Supporting Research and Technology Program, the Heliophysics Guest Investigator Program, and the Living With a Star Targeted Research & Technology Program. We thank D. H. Brooks for useful discussions regarding EIS data analysis. Hinode is a Japanese mission developed and launched by ISAS/JAXA, collaborating with NAOJ as a domestic partner, NASA and STFC (UK) as international partners. Scientific operation of the Hinode mission is conducted by the Hinode science team organized at ISAS/JAXA. This team mainly consists of scientists from institutes in the partner countries. Support for the post-launch operation is provided by JAXA and NAOJ (Japan), STFC (U.K.), NASA (U.S.A.), ESA, and NSC (Norway).