


ABSTRACT
A multi-epoch Hα survey of the late-type spiral galaxy NGC 2403 has been completed in order to determine its nova rate. A total of nine nova candidates were discovered in 48 nights of observation with two different telescopes over the period from 2001 February to 2012 April. After making corrections for temporal coverage and spatial completeness, a nova rate of 2.0+0.5− 0.3 yr−1 was determined. This rate corresponds to a luminosity-specific nova rate of 2.5 ± 0.7 novae per year per 1010 L☉, K. This value is consistent with that of the similar Hubble-type galaxy, M33, and is typical of those of other galaxies with measured nova rates, which range from 1 to 3 novae per year per 1010 L☉, K.
Export citation and abstract BibTeX RIS
1. INTRODUCTION
Population synthesis models have predicted that the infrared (e.g., K band) luminosity-specific nova rate (LSNR) of a galaxy should be sensitive to its star formation history, with younger stellar populations producing nova eruptions at a higher rate (Yungelson et al. 1997). This dependence is the result of an inverse correlation between the average mass of the white dwarfs in nova progenitor binaries and the time elapsed since the zero-age main-sequence system formed (Tutukov & Yungelson 1995). Since novae harboring higher mass white dwarfs are expected to exhibit more frequent, and more luminous, eruptions (Ritter et al. 1991; Livio 1992; Kolb 1995), galaxies that form most of their stars in an early burst of star formation (i.e., ellipticals) were not expected to be prolific nova producers. On the other hand, galaxies that have experienced a more uniform star formation rate over time, such as late-type spiral galaxies, were predicted to have higher LSNRs.
In recent years, nova surveys have been conducted in galaxies spanning a range of Hubble types, providing the opportunity to study novae in isolated stellar populations (Shafter 2008). Ciardullo et al. (1990a) first published a study of galaxies with measured nova rates from which they concluded that the K-band LSNR was basically independent of Hubble type. Several years later, however, Della Valle et al. (1994) re-analyzed many of these same galaxies and concluded that the LSNRs are systematically higher in the late-type, low-mass galaxies compared with their earlier type counterparts. Since these first two pioneering studies, several additional nova surveys have been conducted (Shara & Zurek 2002; Ferrarese et al. 2003; Williams & Shafter 2004; Coelho et al. 2008; Güth et al. 2010). Like Shafter et al. (2000), most of these studies also failed to find compelling evidence that the LSNR varies significantly with Hubble type.
To make further progress in determining how sensitive the LSNR may be to the properties of the underlying stellar population, it is important to obtain nova rates for additional galaxies spanning a broad range of Hubble types. Here we report the results of a multi-year survey to determine the nova rate in the late-type spiral galaxy NGC 2403.
2. OBSERVATIONS
NGC 2403 was observed over a total of 48 nights from 2001 February until 2012 April, as summarized in Table 1. The data were collected with two telescopes: the Steward Observatory's 2.3 m Bok Telescope (BT) and the 2.5 m Isaac Newton Telescope (INT). The BT observations were obtained with the 90Prime Camera (Williams et al. 2004), which contains a mosaic of four 4 K × 4 K CCDs at prime focus. The INT observations were made with the Wide Field Camera (WFC), which contains a mosaic of four thinned EEV 2 K × 4 K CCDs at prime focus. The CCDs have a pixel size of 13.5 μm, which corresponds to a plate scale of ∼0.33 arcsec pixel−1. The edge-to-edge limit of the mosaic, neglecting the 1 arcmin inter-chip spacing, is 34 arcmin. We used archival images stored in the Isaac Newton Group Archive as well as recent images taken during three D-nights in 2011–2012.
As in previous nova surveys, we chose to image NGC 2403 in Hα. Imaging in Hα offers several advantages over broadband observations (Ciardullo et al. 1990b). Novae develop strong Hα emission lines shortly after eruption that persist long after the continuum has faded. As a result novae are more easily detected in synoptic surveys like ours. Second, the Hα images provide a greater contrast against the bright galaxy background than do broadband observations. The greater contrast results in increased survey completeness in the bright central regions of galaxies. Finally, Hα observations are less affected by extinction internal to the target galaxy than are broadband observations, which are typically taken at shorter wavelengths. The BT observations employed a narrowband Hα filter centered at 6580 Å with an FWHM of ∼80 Å, while the INT data were taken through a similar Hα filter having a 95 Å FWHM centered at 6568 Å. The slight differences in the characteristics of the Hα filters do not significantly affect our results given the intrinsic variation in nova Hα emission line widths.
For the INT images, standard reduction procedures for raw CCD images were applied (bias subtract and flat-field correction) using APHOT, a synthetic aperture photometry and astrometry software developed by M. Velen and P. Pravec at the Ondřejov observatory (see Pravec et al. 1994), and SIPS4 programs. Reduced images of the same epoch were co-added to improve the signal-to-noise ratio. The gradient of the galaxy background of co-added images was flattened by the spatial median filter using SIPS.
Data obtained with the BT were first processed using custom software. Since NGC 2403 fell on a single CCD of the four CCD 90Prime Camera, only the CCD containing NGC 2403 was processed. Given that each CCD is read out by two amplifiers, with the data stored separately, the individual amplifier images were first orientated properly and stitched together to create the final image. Known bad pixels/columns were masked prior to further analysis. After re-constructing each image, roughly 10–20 bias frames were combined into a single average bias. Similarly, 10–20 dark frames with an exposure time matched to the object exposure time were combined into an average dark. Five to ten twilight sky flats were averaged to construct the appropriate flat. Object data were bias subtracted, dark subtracted, and flat fielded using the average calibration frames. A rough coordinate system was assigned to each image given the known pointing and knowledge of the focal plane geometry.
Following these basic reduction steps, a WCS system was assigned to each individual frame using subpackages of the IRAF task MSCRED. Using the rough coordinate system defined above, a catalog of bright sources was generated and overlaid on the image. Using MSCTPEAK, 30–40 of the catalog sources were associated with counterparts on the image. A fourth- or fifth-order polynomial was then fit to minimize the residuals and used to transform all catalog sources to the image system. After the distortion coefficients were determined as described, each individual image was projected onto a regular grid centered on the nominal coordinates of NGC 2403 using MSCIMAGE. For a given epoch, all projected images were combined using MSCSTACK, and for comparison between epochs, WREGISTER was used to align each epoch to a common system.
2.1. Nova Detection
Nova candidates were selected based on their observed brightness and the nature of their variability. Novae are transient variables with a rapid rise to peak luminosity (−10 ≲ MV ≲ −6) followed by a slower return to quiescence with a timescale that varies significantly from nova to nova. It is often challenging to differentiate low-luminosity novae from long-period variables (LPVs), such as Mira variables, which have similar luminosities. Unlike novae, however, LPVs are sources with a limited magnitude range that can be detected multiple times in a survey having a sufficiently deep limiting magnitude and sufficiently long time coverage. Thus, to qualify as a nova, a variable source had to appear suddenly (i.e., not be detected in prior epochs) and then fade (or disappear completely) in subsequent epochs. The fields of all nova candidates were scrutinized to make sure that the nova candidates were undetectable in all epochs observed more than a year from the date of discovery. For eliminating the possibility that some of our faint nova candidates could be in fact red LPVs, we also used V-, R-, and I-band images of NGC 2403 taken with the Suprime-Cam mounted on the 8.2 m Subaru Telescope and obtained from the SMOKA (Baba et al. 2002). Using these images we rejected a few faint nova candidates, due to their presence on images obtained well before or after the Hα detection and their apparently red color, which suggests that they are red LPVs around maximum light.
For the images obtained with the BT, identification of the candidates in the crowded and complex background of NGC 2403 was expedited using the ISIS package (Alard & Lupton 1998), which aligns the images over all epochs and differences them. The resulting images are subsequently blinked by eye to reveal variable sources. Of the several transient sources discovered, two passed our criteria for inclusion as novae: N2403 2005-10a and 2005-12a. NGC 2403 is host to a number of H ii regions, which are bright in Hα and are difficult to cleanly difference with ISIS. In the attempt to recover possible candidates in these regions, as well as the nucleus of the galaxy, the IRAF median routine was performed using a variety of box sizes, with a 9 × 9 pixel box producing the cleanest images. With the bright background light of NGC 2403, blinking the median-subtracted images further enhanced the completeness of our survey. This process, however, did not produce any additional nova candidates.
The nova candidates from the INT images were identified through a visual comparison of a given image with a high-quality master image after the images had been flattened by median filtering. Master images, which were created from images separated by at least three years from the epoch being searched, were obtained under very good seeing conditions that resulted in deeper limiting magnitudes compared with the searched image. For comparison with the deepest images, we used a master image created from the combination of more than one epoch. Once transient sources were identified, their transient nature was confirmed through a comparison with all other INT images and the Subaru images. Finally, the confirmed transients found in the INT images were cross-checked against our BT images to assure that they were not visible at other epochs. A similar cross-check was performed for the BT candidates using the INT images. Although our nova search method might seem overly simplistic, we have found that it does a better job in detecting transient sources in a galaxy such as NGC 2403 where the complex structures of Hα regions render more sophisticated and automated detection methods less effective in the discovery of transient point sources.
2.2. Nova Astrometry and Photometry
Astrometry of novae discovered in the INT data was conducted in APHOT using positions of field stars from the UCAC2 (Zacharias et al. 2004). Derived positions of novae have uncertainties in order of tenths of an arcsecond. Astrometry of the two BT novae, as well as photometry of all novae in our survey, was carried out with the aid of the IRAF phot routine in the APPHOT package. Magnitudes for the novae were then determined through a differential comparison with respect to three secondary Hα standard stars. The secondary standard stars, N2403-S1 ( ), N2403-S2 (
 ), N2403-S3 (
 ), were calibrated with respect to the photometric standard Feige 34 (Stone 1977), and found to have mHα = 15.18, mHα = 16.00, and mHα = 16.46, respectively. As in our previous surveys (Shafter & Irby 2001; Williams & Shafter 2004; Coelho et al. 2008; Güth et al. 2010), we have assumed a 100% filling factor for the Hα filter. This assumption allows consistency between surveys, with the recognition that the bandpass will not always be filled by a particular nova's Hα emission. For computing of offsets of particular novae from the NGC 2403 center we used
  as the reference position for the center of NGC 2403.
Table 2 contains the dates, positions, and mHα of all nine candidates found in our survey. Each candidate was detected in at least one subsequent epoch. Two of the candidates, N2403 2001-02a and N2403 2010-02a, were found to have very slow fade rates of greater than 6 months, indicating that these are particularly slow novae.
3. THE NOVA RATE IN NGC 2403
3.1. The Survey Completeness
An estimate of the nova rate in NGC 2403 requires a knowledge of the completeness of the survey as a function of magnitude. Unlike our previous surveys (e.g., Coelho et al. 2008; Güth et al. 2010), the present study has been conducted using different telescopes, instruments, and observing conditions. As a result, the limiting magnitude of our observations varies significantly over each epoch of observation. To account for this variability the completeness of each epoch should be assessed separately. In our earlier studies, we have determined the survey completeness by performing artificial star tests using the IRAF routine addstar. Rather than conduct artificial star tests on each of the 48 nights individually (which would be impractical), we have chosen to perform the artificial star tests on a single "fiducial" image and then shift this completeness function by an amount Δmi appropriate for images obtained in each of the remaining epochs. The value of Δmi (=mlim, 0 − mlim, i) is simply the difference in magnitude between the faintest star that can be reliably detected in our fiducial epoch and that in the ith epoch.
We began the completeness tests by creating artificial novae with magnitudes ranging between mHα = 18.0 and mHα = 24.0, which were then divided into 12 equally spaced 0.5 mag bins. Next, following the spatial distribution of the K-band light (from the data of Pierini et al. 1997), 100 artificial novae in each magnitude bin were randomly distributed throughout the fiducial image, which we take to be the BT image from 2005 December 28. We searched for these artificial "novae" following the same procedures as the ones employed to discover the actual novae. In practice, however, our detection criteria were somewhat different. In conducting our artificial star tests, the completeness at a given magnitude was simply taken to be the fraction of artificial novae recovered. On the other hand, for a transient source to qualify as an actual nova candidate, we required that it be ∼0.5 mag brighter than that required for a mere detection. To compensate for this difference in detection criteria, we have applied a corresponding 0.5 mag correction to each magnitude bin of the completeness function. This correction renders the effective limiting magnitude of the fiducial epoch 0.5 mag brighter than it would be if based directly on the artificial star tests. The resulting completeness function for the fiducial image, C(m), is shown in Figure 1. For this epoch, the recovered nova fraction starts to decline steeply at a magnitude of mHα ≃ 21.5. The completeness function for the ith epochs can then be simply estimated as C(m + Δmi).

Figure 1. Completeness function, C(m), for our fiducial image showing the fraction of test novae recovered in our artificial star tests as a function of Hα magnitude.
Download figure:
Standard image High-resolution image3.2. The Monte Carlo Procedure
We have estimated the nova rate in NGC 2403 by employing a Monte Carlo simulation similar to that we applied previously for M101 and M94 (Coelho et al. 2008; Güth et al. 2010). As just described, a difference in our approach here is that we have explicitly taken into account differences in completeness at various epochs. In the current analysis, we compare the number of novae discovered in our survey (nobs = 9) with an estimate of the number of novae we would expect to see, Nobs, which is a function of our survey depth, temporal sampling, and of course, R, the intrinsic nova rate in NGC 2403. We begin by computing, for a wide range of possible R, a set of model Hα light curves based on randomly selected peak magnitudes and decay rates for M31 and M81 novae (Shafter & Irby 2001; Neill & Shara 2004). Then, based on the dates of our survey (see Table 1) and our adopted distance to NGC 2403 (μ0 = 27.48 ± 0.10; Freedman et al. 2001), we computed an observed nova luminosity function for each epoch, ni(m, R), over the complete range of possible intrinsic nova rates, R. Finally, the resulting luminosity function was convolved with the completeness function, C(m + Δmi), appropriate for the ith epoch, and then summed over all epochs to determine the expected number of novae in NGC 2403:

where Δmi = mlim, 0 − mlim, i. As part of a Monte Carlo process, we repeated the above procedure 105 times over the range 1 < R(yr−1) < 10 in steps of 0.1 yr−1, and recorded the number of times that Nobs(R) matched nobs = 9, the actual number of novae identified in this survey. After normalizing the number of matches as a function of R, we obtained the probability distribution function shown in Figure 2. The most probable nova rate is represented by the peak in the distribution at 2.0+0.5− 0.3 yr−1, where the error range encompasses 50% of the integrated probability distribution.

Figure 2. Results from the Monte Carlo simulation for the nine nova candidates. The peak in the normalized probability distribution (R = 2.0+0.5− 0.3 yr−1) represents the most probable nova rate in NGC 2403.
Download figure:
Standard image High-resolution imageAs a consistency check, we have also analyzed the BT and INT data sets independently. Despite the small number of novae detected in the BT survey, as shown in Figure 3, the two runs yielded consistent results with the BT and INT surveys giving nova rates of 2.0+0.8− 0.4 and 1.8+0.6− 0.2 novae per year, respectively.
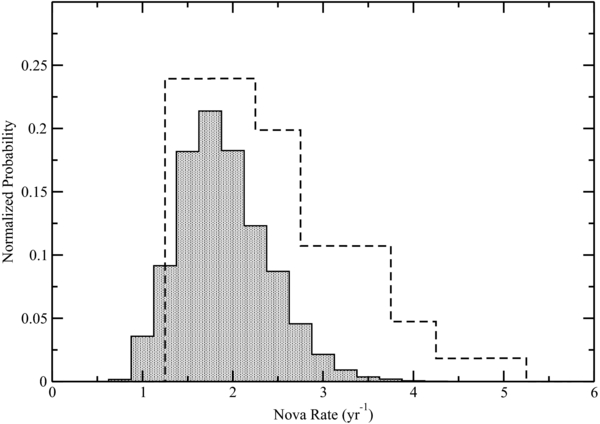
Figure 3. Comparison of the results from the Monte Carlo simulation for the two data sets. The shaded region represents the results for the seven novae observed with the INT, with a corresponding nova rate of R = 1.8+0.6− 0.2 yr−1. The dashed histogram represents the two novae discovered with the BT, with a peak in the probability at R = 2.0+0.8− 0.4 yr−1.
Download figure:
Standard image High-resolution image3.3. The Mean Nova Lifetime Procedure
In addition to our Monte Carlo calculation, we have also made an estimate of the nova rate using a mean nova lifetime method, which is similar to the method first employed by Zwicky (1942) to determine extragalactic supernova rates. This method, which has been described in several previous efforts to determine extragalactic nova rates (e.g., Shafter 2008, and references therein), suffers from the major drawback that it requires the adoption of a specific limiting magnitude for the survey. The method implicitly assumes that all novae brighter than the limiting magnitude are discovered, while all novae fainter than the limiting magnitude are missed. This is clearly not the case as demonstrated by our artificial star tests (see Figure 2). In addition, the method implicitly assumes that there is no variation in the limiting magnitude from epoch to epoch.
In order to correct these limitations, we have modified the traditional mean nova lifetime calculation as follows. In the case of multi-epoch surveys where the limiting magnitude varies with epoch, the nova rate, R, in the surveyed region can be expressed as

where ni(M < Mc, i) is the total number of novae observed in the ith epoch that are brighter than the absolute magnitude Mc, i where 50% of the novae are expected to be recovered, and Te is the "effective survey time." The effective survey time depends both on the mean nova lifetime, τc, i, which is defined as the length of time a typical nova remains brighter than the limiting absolute magnitude of the ith epoch, and the frequency of sampling in the survey. We have
where ti is the time of the ith observation. Based on observations from the bulge of M31, Shafter et al. (2000) have provided a simple calibrated relationship between τc, i and Mc, i, which we implement here:

Values of Mc, i corresponding to 50% completeness at a given epoch have been determined using the completeness functions described in Section 3.1, taking μ0 = 27.48 ± 0.10 (Freedman et al. 2001), and assuming a foreground Galactic extinction of AB = ∼0.17 mag (Schlegel et al. 1998). The effective survey time was then calculated using the survey dates provided in Table 1, coupled with Equations (3) and (4). We find Te = 3466 ± 36 days. Noting that eight of the nine novae discovered satisfy the condition that M < Mc, i at the time of discovery, Equation (2) then yields a nova rate of 1.7 ± 0.6 yr−1. Given the uncertainties inherent in this method, the nova rate agrees reasonably well with the value determined in the more sophisticated Monte Carlo calculation.
Table 1. Summary of Observationsa
| UT Date | Julian Date | Number of | Total Integration Time | mlim |
|---|---|---|---|---|
| (2,450,000+) | Exposures | (hr) | ||
| 2001 Feb 21 | 1962.417 | 1 | 0.67 | 22.3 |
| 2002 Dec 30 | 2638.624 | 1 | 0.33 | 23.1 |
| 2004 Jan 30 | 3035.464 | 1 | 0.5 | 22.3 |
| 2004 Feb 12 | 3048.420 | 1 | 0.5 | 21.9 |
| 2005 Jan 1 | 3385.449 | 1 | 0.08 | 21.5 |
| 2005 Mar 20 | 3450.392 | 1 | 0.25 | 22.2 |
| 2005 Oct 30b | 3673.860 | 10 | 2.5 | 22.1 |
| 2005 Oct 31b | 3675.006 | 2 | 0.5 | 22.1 |
| 2005 Dec 28b | 3732.840 | 14 | 3.5 | 23.1 |
| 2006 Feb 6b | 3772.679 | 8 | 2.0 | 23.3 |
| 2006 Feb 7b | 3773.690 | 2 | 0.42 | 23.3 |
| 2006 Feb 21b | 3787.801 | 6 | 1.5 | 22.7 |
| 2006 Feb 23b | 3789.641 | 4 | 1.0 | 22.7 |
| 2006 Mar 11 | 3806.409 | 1 | 0.5 | 22.7 |
| 2006 Mar 14 | 3809.447 | 1 | 0.55 | 22.0 |
| 2006 Apr 19b | 3844.668 | 8 | 2.0 | 22.4 |
| 2006 Oct 30 | 4038.743 | 1 | 0.13 | 20.5 |
| 2006 Nov 28b | 4067.874 | 10 | 2.0 | 22.9 |
| 2006 Dec 13b | 4082.800 | 15 | 2.5 | 23.1 |
| 2006 Dec 27 | 4096.619 | 1 | 0.56 | 22.1 |
| 2007 Jan 1 | 4103.673 | 1 | 0.33 | 20.8 |
| 2007 Jan 4 | 4104.554 | 1 | 0.33 | 20.7 |
| 2007 Jan 6 | 4106.638 | 1 | 0.33 | 20.9 |
| 2007 Jan 9 | 4109.618 | 1 | 0.33 | 19.7 |
| 2007 Jan 27b | 4127.683 | 14 | 2.33 | 23.2 |
| 2007 Mar 11b | 4170.652 | 18 | 3.0 | 22.7 |
| 2007 Sep 29 | 4372.733 | 1 | 0.33 | 21.9 |
| 2007 Sep 30 | 4373.726 | 1 | 0.33 | 21.2 |
| 2008 Jan 28 | 4494.490 | 2 | 1.0 | 23.7 |
| 2008 Jan 30 | 4495.579 | 3 | 1.25 | 20.8 |
| 2008 Oct 12 | 4751.685 | 2 | 1.0 | 22.7 |
| 2008 Oct 13 | 4752.667 | 1 | 0.5 | 21.4 |
| 2008 Oct 25 | 4764.700 | 1 | 0.34 | 21.6 |
| 2008 Oct 26 | 4765.744 | 1 | 0.17 | 21.2 |
| 2008 Oct 28 | 4767.729 | 2 | 0.79 | 23.0 |
| 2008 Nov 18 | 4788.624 | 2 | 1.0 | 22.4 |
| 2009 Jan 19 | 4851.453 | 2 | 1.0 | 22.3 |
| 2009 Jan 21 | 4852.609 | 2 | 1.0 | 22.8 |
| 2009 Jan 22 | 4853.610 | 1 | 0.5 | 22.6 |
| 2009 Feb 17 | 4880.443 | 1 | 0.17 | 22.0 |
| 2009 Feb 19 | 4882.392 | 1 | 0.17 | 21.3 |
| 2009 Apr 11 | 4933.402 | 2 | 1.0 | 23.0 |
| 2009 Apr 12 | 4934.404 | 2 | 1.0 | 23.4 |
| 2010 Feb 5 | 5233.443 | 2 | 1.0 | 23.6 |
| 2010 Sep 20 | 5459.709 | 2 | 1.0 | 22.8 |
| 2011 Mar 23 | 5644.456 | 1 | 0.08 | 21.6 |
| 2012 Jan 21 | 5947.709 | 1 | 0.5 | 22.4 |
| 2012 Apr 28 | 6046.416 | 1 | 0.5 | 22.0 |
Notes. aUnless otherwise noted, observations were taken with the 2.5 m INT. bData obtained with the 2.3 m BT.
Download table as: ASCIITypeset image
Table 2. NGC 2403 Nova Candidates
| Nova | Julian Date | α | δ | a | mHα |
|---|---|---|---|---|---|
| (2,450,000+) | (J2000.0) | (J2000.0) | (arcmin) | (mag) | |
| N2403 2001-02a | 1962.417 | 07 37 21.90 | 65 33 49.7 | 3.92 | 20.9 |
| 2638.624 | ... | ... | ... | 22.1 | |
| N2403 2002-12aa | 2638.624 | 07 37 38.36 | 65 36 29.8 | 6.05 | 18.3 |
| 2638.635 | ... | ... | ... | 20.9b | |
| 2643.5 | ... | ... | ... | 21.4c | |
| N2403 2005-01aa | 3385.449 | 07 36 53.98 | 65 34 54.7 | 1.65 | 19.3 |
| 3450.392 | ... | ... | ... | 19.7 | |
| 3806.409 | ... | ... | ... | 21.9 | |
| 3808.453 | ... | ... | ... | 21.8 | |
| N2403 2005-10ad | 3673.860 | 07 37 43.07 | 65 36 05.4 | 6.40 | 21.8 |
| 3732.840 | ... | ... | ... | 23.1 | |
| N2403 2005-12ad | 3732.840 | 07 36 53.79 | 65 32 03.5 | 5.66 | 21.0 |
| 3772.679 | ... | ... | ... | 21.4 | |
| 3787.801 | ... | ... | ... | 21.6 | |
| N2403 2007-09a | 4372.733 | 07 36 47.72 | 65 37 04.0 | 1.19 | 19.6 |
| 4373.726 | ... | ... | ... | 19.7 | |
| N2403 2008-01a | 4494.490 | 07 37 01.33 | 65 35 14.7 | 1.38 | 20.7 |
| 4495.579 | ... | ... | ... | 20.9 | |
| N2403 2009-03ae | 4933.402 | 07 36 35.04 | 65 40 21.4 | 5.47 | 19.2 |
| 4934.404 | ... | ... | ... | 19.1 | |
| N2403 2010-02a | 5233.443 | 07 36 30.57 | 65 35 14.3 | 3.31 | 19.4 |
| 5459.709 | ... | ... | ... | 22.0 |
Notes. The units for right ascension are hours, minutes, and seconds. The units for declination are degrees, arcminutes, and arcseconds. We assume these values to be accurate to ∼1''. The parameter a is the isophotal radius of the nova. Unless otherwise noted, novae were identified using the 2.5 m INT. aDiscovery first reported in Hornoch (2008). br-band magnitude taken with the 2.5 m INT with the WFC instrument. cR-band magnitude taken with the 0.41 m telescope at Kitt Peak with the ST-10XME instrument. dNova found using the 2.3 m BT with the P90 camera. eNova discovered independently by P60-FasTING (Kasliwal et al. 2009).
Download table as: ASCIITypeset image
3.4. Luminosity-specific Nova Rate
To compare nova rates between different galaxies, it is necessary to normalize the rates by the luminosity of the galaxy. Typically, the rates are normalized by the integrated infrared K-band luminosity, which provides a better tracer of the mass in stars than does visual light. The resulting K-band LSNR, νK, is usually parameterized as the number of novae per year per 1010 L☉, K.
The K-band luminosity of NGC 2403 has been determined using the integrated K-band magnitude of 6.19 ± 0.04 measured in the Two Micron All Sky Survey's (2MASS) Large Galaxy Atlas (Jarrett et al. 2003). At the distance of N2403, a nova rate of 2.0+0.5− 0.3 yr−1 yields νK = (2.5 ± 0.7) × 10−10 L☉, K yr−1. The LSNR of NGC 2403 is typical of those of other galaxies with measured nova rates (e.g., see Güth et al. 2010), and is consistent with that of the similar Hubble type galaxy, M33, where νK = (2.17 ± 0.89) × 10−10 L☉, K yr−1 (Williams & Shafter 2004).
3.5. The Nova Spatial Distribution
In Figure 4, we have plotted the positions of all nine nova candidates discovered in our overall survey over an image of the galaxy from the BT observations. To further explore the spatial distribution of the novae, we have used the K-band photometry of Pierini et al. (1997) to compute the radii of the isophotes that pass through the nova positions. The cumulative distribution of the nova isophotal radii is compared with the cumulative distribution of the galaxy's K-band light in Figure 5. The integrated K-band light falls off somewhat more rapidly than the observed nova distribution. A Kolmogorov–Smirnov (K-S) test shows that there is a 25% chance that the distribution would differ by as much as observed if they were drawn from the same parent distribution (i.e., if the nova frequency was proportional to the surface brightness of the galaxy). Thus, it is possible that the nova distribution is incomplete in the inner regions of the galaxy where the background is particularly bright and inhomogeneous.

Figure 4. Spatial distribution of the nine nova candidates found in NGC 2403 plotted over the 2007 March 11 image of the galaxy from the BT survey. The squares indicate the positions of the two novae discovered in the BT survey. The image is approximately 18' on a side with N up and E left.
Download figure:
Standard image High-resolution image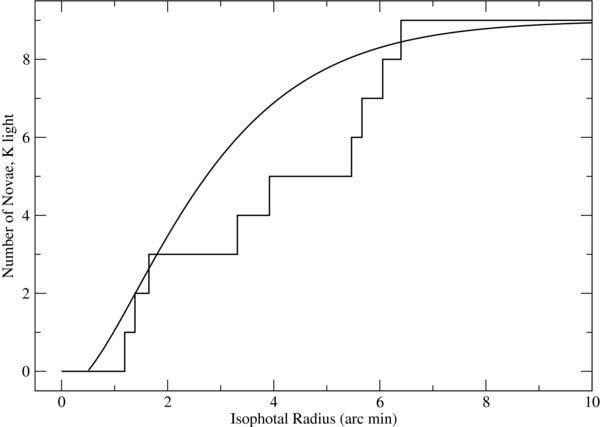
Figure 5. Cumulative nova distribution compared with the integrated K-band light (smooth curve) of Pierini et al. (1997). A K-S test (KS = 0.25) suggests that the background galactic light falls off faster than the observed nova distribution.
Download figure:
Standard image High-resolution image
4. DISCUSSION
The nova survey of NGC 2403 is a continuation of an effort to understand the role that the host galaxy morphology has on its nova rate. Previous surveys have yielded conflicting results with Della Valle et al. (1994) arguing that the LSNR is a function of Hubble type (with late-type galaxies being more prolific nova producers), while Ciardullo et al. (1990a) and many subsequent studies (e.g., Shafter et al. 2000; Williams & Shafter 2004; Coelho et al. 2008; Güth et al. 2010) have found that the LSNR is insensitive to Hubble type. Exceptions seem to be the Large Magellanic Cloud (LMC) and Small Magellanic Cloud (SMC), where the LSNRs appear to be elevated by a factor of 2–3 when compared with other galaxies for which nova rates have been measured. Their relatively low luminosities (and correspondingly low absolute nova rates) render the LSNRs for the LMC and SMC particularly uncertain. More work needs to be done on these galaxies before we can be confident in their LSNRs.
Among the late-type spiral galaxies, M33 (SA(s)cd; de Vaucouleurs et al. 1991) has been particularly noteworthy. Williams & Shafter (2004) found a nova rate of 2.5+1.0− 0.7 per year while Della Valle et al. (1994) found a rate, 4.6 ± 0.9, that was almost a factor of two higher. This difference resulted in Della Valle et al. (1994) finding an elevated LSNR for M33 that was comparable to that of the LMC, while the value determined by Williams & Shafter (2004), 2.17 ± 0.89 novae per year per 1010 L☉, K, was typical of most other galaxies which tend to lie in a range of 1–3 novae per year per 1010 L☉, K. NGC 2403 (SAB(s)cd; de Vaucouleurs et al. 1991) is interesting in that it represents a near morphological clone of M33. Our estimate of νK = (2.5 ± 0.7) × 10−10 L☉, K yr−1 for NGC 2403 is typical of other galaxies, and is consistent with the value for M33 determined by Williams & Shafter (2004).
It is worth noting that the spatial distribution of the novae in NGC 2403 does not uniformly follow the background K-band light distribution of the galaxy, as shown by Figures 4 and 5. The light distribution falls off faster than the nova distribution, which suggests either that novae are more frequent in the outer disk regions, or that we may be missing more novae in the brighter central region of the galaxy. The latter possibility is more likely given that our artificial star tests show that the completeness is reduced somewhat at small isophotal radii. Since the completeness over the entire galaxy is taken into account by our Monte Carlo simulation, our derived LSNR is not affected.
A potential source of error implicit in our analysis concerns our assumption that the Hα light curves used in the Monte Carlo simulation (which are based on novae observed in M31 and M81) are characteristic of novae in NGC 2403. It is possible that the nova speed classes are a function of stellar population. If, for example, the novae in NGC 2403 are "faster" than those observed in M31 and M81, as has been suggested for the LMC (e.g., Della Valle & Duerbeck 1993; Capaccioli et al. 1990), or if there is a significant population of "faint and fast" novae in M31 (e.g., Kasliwal et al. 2011) that are not represented in our model light curves, then our Monte Carlo simulations would underestimate the true nova rate in NGC 2403 (i.e., a lower assumed intrinsic nova rate in a population of "slower" novae would suffice to produce the observed number of novae). That said, given the fact that two of the nine novae observed in NGC 2403 faded particularly slowly, and were visible for over 6 months, it is clear that the NGC 2403 novae are unlikely to be significantly faster, on average, compared with those seen in M31 and M81.
5. CONCLUSIONS
Over the course of 48 nights spanning more than a decade, we have identified a total of nine nova candidates in NGC 2403. Two of the candidates faded from peak brightness slowly, but were not seen in prior epochs and did not reappear in any later epochs. Based on a Monte Carlo simulation, our best estimate for the nova rate of NGC 2403 is 2.0+0.5− 0.3 yr−1. The observations were taken using two telescopes, the 2.3 m BT and the 2.5 m INT, which yielded a total of 12 and 36 nights of observation, respectively. If analyzed separately, our estimate of the nova rate for the INT is R = 1.8+0.6− 0.2 yr−1 and R = 2.0+0.8− 0.4 yr−1 for the BT, each of which are consistent with our combined nova rate. Based on the integrated K magnitude from the 2MASS survey, we estimate the LSNR to be νK = 2.5 ± 0.7 novae per year per 1010 L☉, K, which is consistent with that of the similar Hubble-type galaxy, M33.
Given the sensitivity of derived nova rates to the photometric evolution of novae (e.g., peak magnitude and rate of decline), future studies of extragalactic nova rates should focus on measuring light curve parameters for novae in galaxies spanning a range of Hubble types. Such studies will require frequent sampling over an extended period of time, and will be facilitated tremendously by observations made with current and planned survey telescopes such as PanStarrs and the LSST.
This research has made use of the NASA/IPAC Extragalactic Database (NED) which is operated by the Jet Propulsion Laboratory, California Institute of Technology, under contract with the National Aeronautics and Space Administration and the SIMBAD database, operated at CDS, Strasbourg, France. We thank Raine Karjalainen for making it possible to use the Isaac Newton Telescope images taken during three D-nights in 2011–2012. This paper makes use of data obtained from the Isaac Newton Group Archive which is maintained as part of the CASU Astronomical Data Centre at the Institute of Astronomy, Cambridge. Based in part on data collected at Subaru Telescope and obtained from the SMOKA, which is operated by the Astronomy Data Center, National Astronomical Observatory of Japan. The work of K.H. was supported by the project RVO:67985815. A.W.S. thanks the NSF for support through grant AST 1009566.