


ABSTRACT
To understand elementary processes leading to H2 formation, and the hydrogenation and deuteration reactions of adsorbed species on dust grains in dense clouds, we experimentally investigated the diffusion of atomic hydrogen and deuterium on amorphous solid water (ASW) at temperatures of 8–15 K. The present study extended our previous study for selective detections of H and D atoms, and of H2 (J = 0 and 1) and D2 (J = 0 and 1) molecules adsorbed on ASW using both photo-stimulated desorption and resonance-enhanced multiphoton ionization, to investigate potential sites on ASW for diffusion, recombination dynamics, and the diffusion mechanism of H and D atoms. Our results demonstrate that the ASW surface contains various potential sites that can be categorized into at least three groups: very shallow, middle-, and deep-potential sites, with diffusion activation energies of ⩽18, 22 (23 meV for D atoms), and ⩾30 meV, respectively. The present study pictured the outline of H2 formation on cosmic ice dust at low temperatures: H atoms landing on the dust will diffuse rapidly at the abundant shallow and middle sites on ASW, and finally become trapped at deep sites. The H atoms that arrive next recombine with such trapped H atoms to yield H2 molecules. The small isotopic difference between the diffusion of H and D atoms on ASW indicates that the diffusion mechanism can be explained by thermal hopping, at least at middle-potential sites.
Export citation and abstract BibTeX RIS
1. INTRODUCTION
Hydrogen is the most abundant molecule in the universe, and thus plays key roles in star formation and in the chemistry of interstellar clouds. Since gas-phase formation of molecular hydrogen (H2) is inefficient to explain its high abundance, H2 is generally considered to form predominantly through surface reactions on dust grains (Gould & Salpeter 1963). In dense clouds, dust grains are covered with amorphous solid water (ASW) because of the low temperatures (∼10 K), and ultraviolet (UV) photons do not penetrate dense clouds. H2 formation on ASW proceeds via elementary processes associated with the H atom: adsorption, diffusion, and recombination with another adsorbed H atom. Since recombination of H atoms is a radical–radical barrierless reaction, the H2 formation rate is limited by the diffusion of H atoms at low coverage on the surface. Hence, diffusion of H atoms on ASW at low temperatures is crucial for H2 formation in dense clouds (Hollenbach & Salpeter 1971). Diffusion on ASW is also of significant importance for surface reactions of nonenergetic H atoms that occur on dust grains, which play a fundamental role in the formation of simple molecules, such as H2O and NH3 (Ioppolo et al. 2008; Miyauchi et al. 2008; Oba et al. 2009; Hidaka et al. 2011), and organic molecules such as H2CO and CH3OH (e.g., Watanabe et al. 2004; Fuchs et al. 2009). Such molecules have been discovered abundantly in the ice mantles of dust grains, and all species (including H2O) require surface reactions to attain the observed abundances (Watanabe & Kouchi 2008). Moreover, deuterium enhancement in interstellar species (e.g., deuterated formaldehyde and methanol) has been observed in protostars (Parise et al. 2004, 2006). Deuterium enrichment in interstellar species has been proposed to result from chemical processes, both in the gas phase (Roberts et al. 2003, 2004) and the solid phase (Nagaoka et al. 2005, 2007; Hidaka et al. 2009). Diffusion of D atoms on ASW is thus necessary to verify the respective importance of gas- versus solid-phase processes for the formation of interstellar deuterated species.
Several groups have experimentally studied the diffusion of H and D atoms on ASW at temperatures of around 10 K, but the results are somewhat contradictory. For example, Manicò et al. (2001) co-deposited H and D atoms onto ASW at 10 K and detected HD molecules resulting from H–D recombination based on the temperature-programmed desorption (TPD) method. From the shape of the TPD spectra of HD molecules, they concluded that these molecules did not form during co-deposition of atoms but during the subsequent increase in temperature of ASW for a very low coverage of atoms. Hornekær et al. (2003), on the other hand, found that HD molecules were observed in TPD spectra only when H and D atoms were co-deposited on ASW, while sequential deposition of H and D atoms did not result in HD formation. They proposed that the formation of HD molecules occurs very efficiently during exposure of ASW to H and D atoms, since atomic diffusion on ASW was fast even at 10 K.
The energy barrier of the diffusion, Ediff, for H or D atoms on ASW has also been estimated by analysis of TPD spectra of HD or D2 molecules. Perets et al. (2005) derived an activation energy of H-atom diffusion on ASW in the range of 41–55 meV, while a lower value of 22 meV for D-atom diffusion was reported subsequently (Matar et al. 2008). The former value indicates that H atoms cannot diffuse efficiently on ASW at low temperatures (∼10 K), but the latter implies fast D-atom diffusion.
Pirronello et al. (2004), Perets et al. (2005), and Vidali et al. (2006) associated the discrepancy of the observed results for the diffusion of atoms with the incident flux of the atoms used for the experiments, and with the resulting coverage on the surface. They suggested that the hot-atom mechanism (i.e., recombination caused by transient mobility before the incident atom fully thermalizes on the surface) becomes appreciable in experiments with high atom flux and coverage, as performed by Hornekær et al. (2003), while diffusion is slow in the low-flux and low-coverage experiment of Manicò et al. (2001). On the other hand, Matar et al. (2008) presumed that the discrepancies among these prior studies stemmed from different assumptions about the surface coverage.
For the diffusion mechanism of H and D atoms on ASW, quantum tunneling and thermal hopping are often advocated (Cazaux & Tielens 2004; Matar et al. 2008; Watanabe et al. 2010). Quantum tunneling is especially effective for reactions involving light atoms such as H at low temperatures (Watanabe & Kouchi 2008). The efficiency of quantum tunneling is often evaluated using a simple rectangular potential barrier. The tunneling frequency, Nqt (s−1), for diffusion is approximately represented by

where ν, a, ħ, and m represent a frequency factor, the barrier width for diffusion, the reduced Planck constant, and the mass of the species, respectively. Nqt is often estimated at around 109–1010 s−1 for H atoms on water ice, assuming Ediff of 30 meV with a of 1 Å, m of 1.7 × 10⁻²⁷ kg, and ν of 1012–1013 s−1 (Tielens 2005; Watanabe & Kouchi 2008). More realistically, however, the barrier shape is usually not simple (i.e., rectangular) and the surface is not a perfectly flat crystalline surface. Smoluchowski (1981, 1983) proposed that diffusion by quantum tunneling is suppressed on ASW, since energy-level matching between the states in adjacent potential wells is not good because of the nonperiodic potential. As for the polycrystalline-ice (PCI) surface, Smoluchowski (1983) predicted that H atoms would spread instantaneously by quantum tunneling to their boundary and become localized there. Buch & Czerminski (1991) also reported very significant localization for the calculated eigenstates of the H and D atoms adsorbed on an amorphous water cluster within energetically accessible regions. They associated this localization with the complexity of the three-dimensional adsorbate-cluster potential.
To our knowledge, theoretical calculations of thermal diffusion of H atoms adsorbed on ASW have, to date, only been performed by Al-Halabi & van Dishoeck (2007). Using molecular dynamics calculations, they derived a very large diffusion coefficient for thermally trapped H atoms on ASW, 1.09 × 10⁻⁵ cm2 s−1 at 10 K. This diffusion coefficient corresponds to a very high thermal-hopping frequency of Ndiff = ∼1010 s−1 (1.09 × 10−5 × 1015 s−1), assuming a flat surface with 1015 sites cm−2. This value is comparable to the Nqt estimated from Equation (1) (Watanabe & Kouchi 2008), and Ediff for thermal diffusion can be estimated at approximately 5 meV from Equation (2),

where kB and T represent the Boltzmann constant and the surface temperature, respectively. Ediff is empirically related to the average binding energy, Eb. Although the ratio of Ediff to Eb would depend on the local adsorption energy, it has often been treated as a constant that ranges from 0.3 to 1.0 (Medved' & Černý 2011). Sladek et al. (1974) pointed out that this ratio can be 0.5 or 1.0 for the diffusion of physically adsorbed species. The value for Ediff (∼5 meV) estimated by Al-Halabi & van Dishoeck (2007) is smaller by a factor of 11 compared with their calculated value (∼56 meV) for the average Eb of H atoms associated with ASW.
Recently, Watanabe et al. (2010) presented the results of a novel type of experiment to shed light on the long-standing debate about the diffusion of H atoms on ASW. They performed direct detection of H atoms adsorbed on ASW using photo-stimulated desorption (PSD) and resonance-enhanced multiphoton ionization (REMPI). They observed attenuation of H-atom signals after H deposition on ASW at a temperature of 8 K, and found the presence of at least two types of potential sites with energy depths of ∼20 and >50 meV on ASW, which cover the different activation barriers for diffusion previously reported by two groups (Perets et al. 2005; Matar et al. 2008). In the present study, we further investigate interactions of atoms and molecules on ASW and PCI based on the PSD and REMPI methods. Selective detections of H and D atoms as well as H2 (J = 0 and 1) and D2 (J = 0 and 1) molecules enable us to discuss potential sites on ASW for diffusion, recombination dynamics, and the diffusion mechanism of H and D atoms on ASW. This way, by also detecting molecular hydrogen and deuterium on the surface, we make sure that the length of the residence time of H on water ice, which was already measured by Watanabe et al. (2010), is really determined by mobility and recombination of H atoms, even at the shallowest sites, and not by monoatomic evaporation.
2. EXPERIMENTAL SETUP
2.1. Apparatus and Experimental Conditions
We performed experiments with the Reaction Apparatus for Surface Chemistry in Astrophysical environments with Laser spectroscopy (RASCAL) apparatus at the Institute of Low Temperature Science, Hokkaido University, which consists of a vacuum sample chamber, a Fourier-transform infrared (FTIR) spectrometer, an atomic source, and two laser systems (Watanabe et al. 2010; Hama et al. 2011).
The vacuum sample chamber was evacuated to ultra-high vacuum conditions (∼10−8 Pa) using two turbo molecular pumps. A mirror-polished aluminum alloy 2017 (Al) substrate was installed at the center of the sample chamber, which is connected to the cold head of an He refrigerator. ASW was produced on the Al substrate at 8 K by vapor deposition through a capillary plate with an incident angle of 67.7°. The solid samples were monitored in situ by the FTIR (see Figure 1). The typical deposition time for ice preparation is 420 s to produce ∼32 L at 8 K, where 1 L ≈ 1.3 × 10⁻⁴ Pa s. The column density of ASW was calculated at 2.1 × 10¹⁶ molecules cm−2 (based on Figure 1(a)). The deposition rate was estimated at approximately 0.04 mg hr−1. This low deposition rate leads to a high-density ASW (∼1.1 g cm−3) with micropores (Watanabe & Kouchi 2008), which contains dangling OH bonds, as can be seen at 3721 and 3698 cm−1 in Figure 1(a). The PCI sample was vapor deposited onto the Al substrate at 145 K for ∼420 s and subsequently cooled to 8 K for the experiments. The typical PCI column density was 1.4 × 10¹⁶ molecules cm−2 (see Figure 1(b)). For calculation of the column density, the integrated absorption coefficients we adopted were 2.0 × 1016 cm molecule−1 for ASW and 2.1 × 1016 cm molecule−1 for PCI (Hagen et al. 1981; Hidaka et al. 2007, 2008).

Figure 1. Infrared absorption spectra over the range of 4000–500 cm−1 of the (a) amorphous solid water (ASW) and (b) polycrystalline ice (PCI) at 8 K.
Download figure:
Standard image High-resolution imageH and D atoms were produced by dissociation of H2 and D2 molecules, respectively, in microwave-discharge plasma in a Pyrex tube. The atoms were cooled through an Al pipe at 100 K, which was connected to another He refrigerator, and the atoms were deposited onto the ice surface through the free-flight region to collimate the beam. The atomic-beam line is composed of three differentially pumped stages. Each chamber was separated by a collimator with an aperture of 1.2 mm in diameter. During the atomic-source operation, the typical pressure of the three stages and that in the sample chamber was 5 × 10⁻³, 2 × 10⁻⁵, 6 × 10⁻⁷, and 2 × 10⁻⁸ Pa, respectively. We estimated a flux of H (D) atoms of about 1011–1012 cm−2 s−1 and derived a lower limit to the dissociation fractions of H2 (D2) molecules of approximately 66% (and 69% for D2); see Section 2.3. In the RASCAL, although the pulsed atomic beam can be produced by a chopper disk (Watanabe et al. 2010), it was removed in the present study to allow estimation of the flux and the coverage of H and D atoms, and for our measurements of the time-of-flight (TOF) spectra of the atoms.
Upon adsorption of the atoms on the ASW surface, the surface number density of H (D) atoms, nH (cm−2), decreases with time because of recombination of atoms and/or monoatomic desorption, as expressed by

where kH−H and kdes are the rate constants for recombination and monoatomic desorption, respectively. Since H–H recombination is a barrierless radical–radical reaction, kH–H is dominated by H-atom diffusion and can thus be expressed as follows for thermal diffusion:

where s is the unit area of the surface site. Using the relation that the coverage of the H (D) atom, θ, is θ = s n0, Equation (4) converts to

where n0 is the initial surface number density of H atoms. When diffusion and recombination are sufficiently faster than monoatomic desorption, the Ediff for atoms can be determined from kH–H n0 and θ.
The present study combines the PSD and REMPI methods to measure the variation of the number density of H (D) atoms, or H2 (D2) molecules present on the surface to obtain kH–H n0 and θ. Details of the experimental procedures have been described previously (Watanabe et al. 2010). In brief, Figure 2 is a schematic illustration of the timing chart for the present experiment in which the delay time between photodesorption and probe laser pulses corresponds to the TOF. The atoms or molecules were photodesorbed from the surface by the unfocused second-harmonics radiation (532 nm) of a neodymium–yttrium–aluminum garnet (Nd3+:YAG) laser with an irradiated area of about 3 mm in diameter at 10 Hz, with a pulse width of ∼4 ns. The power of the 532 nm laser was ∼20 μJ pulse−1 (∼7 × 10⁴ J s−1 cm−2).
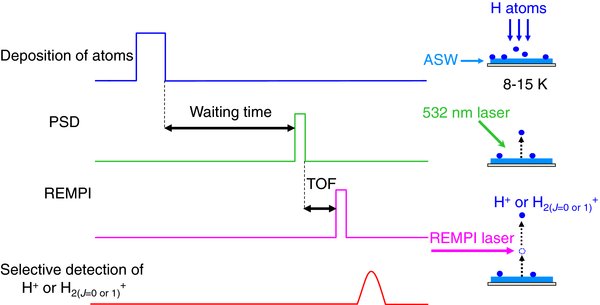
Figure 2. Schematic illustration of the timing chart for the present experiment. The delay time between photodesorption and probe laser pulses corresponds to the time of flight (TOF). PSD and REMPI represent photo-stimulated desorption and resonance-enhanced multiphoton ionization, respectively. Photodesorbed species is selectively ionized by REMPI. When we measure the TOF spectra of the atoms (Figure 3), and estimate the flux and the coverage of H and D atoms (Figures 4 and 5), the PSD and REMPI are performed under continuous molecular or atomic deposition onto amorphous solid water (ASW).
Download figure:
Standard image High-resolution imageThe photodesorbed species was selectively ionized by (2+1) REMPI and subsequently detected with a TOF mass spectrometer aligned perpendicularly to the ice surface. The REMPI laser was focused at approximately 1 mm above the ASW surface. H and D atoms were ionized via the two-photon 2s(2S1/2) ← 1s(2S1/2) transition at 243.07 and 243.00 nm, respectively (Zumbach et al. 1997). H2 and D2 molecules were ionized via the two-photon E,F1 (v' = 0, J' = J) ← X1 (v = 0, J = 0 or 1) transitions in the wavelength range of 201–203 nm (Pomerantz et al. 2004). Radiation of ∼100 μJ pulse−1 at the requisite wavelengths was produced by a dye laser pumped with another Nd3+:YAG laser, with subsequent frequency doubling and mixing in potassium dihydrogen phosphate and barium borate crystals
2.2. Time-of-flight Spectra of Photodesorbed H and D Atoms Following 532 nm Irradiation of ASW under Continuous Atomic Deposition
We first measured TOF spectra of the H and D atoms taken as a function of the delay time between the photodesorption and REMPI laser pulses. Figure 3 shows typical TOF spectra of photodesorbed H and D atoms from ASW and PCI at various temperatures. During the TOF measurements, the atoms were continuously deposited onto ASW through continuous irradiation by the photodesorption laser at 10 Hz for PSD. In these continuous deposition and irradiation conditions, the number density of atoms on the surface was found to be constant because of the balance between H-atom supply and loss by recombination and photodesorption (and probably a little monoatomic desorption as well). The typical duration to obtain a TOF spectrum is 120–180 s. TOF spectra of photodesorbed H and D atoms from ASW and PCI were reproduced by a single Maxwell–Boltzmann (MB) distribution with a translational temperature, Ttrans, of 35–50 K. Details regarding the analysis of such TOF spectra have been reported in Yabushita et al. (2004) and Hama et al. (2009). Ttrans = 35–50 K corresponds to 6–9 meV, assuming that the translational energy is 2kBTtrans (Zimmermann & Ho 1994, 1995). The signal intensities increased linearly as the power of the 532 nm photodesorption laser increased up to ∼40 μJ pulse−1, while the translational energy was independent of laser power. In our TOF spectral measurements, the ice sample was heated to 30 K each time to flush residual atoms or molecules from the surface after the measurements, and cooled to 8, 12, or 15 K to continue the experiments. We confirmed that this method exhibited reproducibility for the results obtained, indicating that undesired effects like evaporation and/or drastic structural changes of ASW were not induced, neither by 532 nm laser irradiation nor by heating to 30 K. Further discussion of the PSD mechanism is presented in the Appendix.
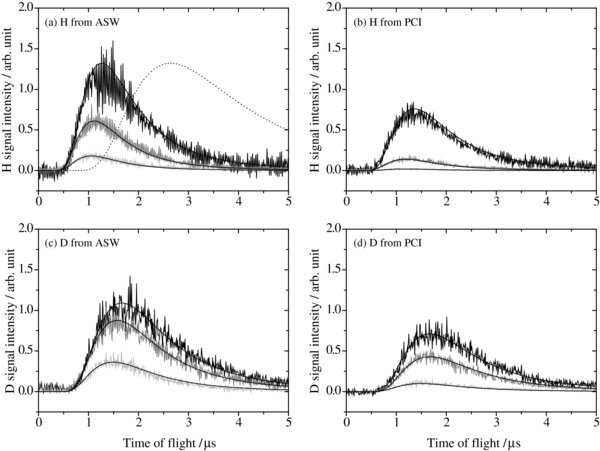
Figure 3. Time-of-flight (TOF) spectra of photodesorbed H and D atoms from amorphous solid water (ASW) and polycrystalline ice (PCI) at various temperatures: (a) H atom from ASW, (b) H atom from PCI, (c) D atom from ASW, and (d) D atom from PCI. The temperatures of ice samples are 8 K (black), 12 K (gray), and 15 K (pale gray). The smooth black lines are fits to the data derived assuming a Maxwell–Boltzmann distribution with a translational temperature of 35–50 K for the spectra of H and D atoms. The translational temperature of each spectrum is summarized in Table 1. The dotted black line in (a) is a fit assuming a translational temperature of 8 K.
Download figure:
Standard image High-resolution imageTable 1 also summarizes the relative area intensities of TOF spectra for H (D) atoms normalized to that from ASW at 8 K. Figure 3 and Table 1 clearly show decreases of all atomic signals as the temperature increases from 8 to 15 K. The temperature effect on the diffusion of atoms will be further discussed in Section 3.4. The absolute intensity for D atoms from ASW at 8 K is comparable with that for H atoms. However, since we did not determine the absolute dissociation fraction in the atomic beams for both H2 and D2, a quantitative comparison between the intensities of H and D atoms may not be appropriate.
Table 1. Relative Intensities and Translational Temperatures of TOF Spectra of H and D Atoms from ASW and PCIa.
| Ice Temperatures | H from ASW | H from PCI | D from ASW | D from PCI |
|---|---|---|---|---|
| 8 K | 1.00 ± 0.11 (35 K) | 0.64 ± 0.03 (30 K) | 1.00 ± 0.04 (40 K) | 0.67 ± 0.01 (40 K) |
| 12 K | 0.42 ± 0.03 (45 K) | 0.10 ± 0.01 (40 K) | 0.76 ± 0.03 (45 K) | 0.36 ± 0.01 (40 K) |
| 15 K | 0.11 ± 0.01 (50 K) | 0.01 ± 0.01 (40 K) | 0.28 ± 0.02 (50 K) | 0.10 ± 0.01 (50 K) |
Note. aH and D signal intensities from ASW and PCI at 8, 12, and 15 K were normalized to the signal intensities of H and D atoms from ASW at 8 K, respectively.
Download table as: ASCIITypeset image
2.3. Estimates of the Flux and the Coverage of H and D Atoms on the Surface
The coverage of atoms, θ, can be derived from the deposition time and the beam flux. First, we estimated the flux of the molecular beam from the beam line without microwave discharge. Figure 4 shows photodesorbed (a) H2 (J = 0 and 1) and (b) D2 (J = 0 and 1) intensities from the Al substrate at 8 K with continuous deposition of molecules within 120 minutes through the beam line. The REMPI spectra of H2 (J = 0 and 1) and D2 (J = 0 and 1) molecules were measured during molecular deposition at TOF (the delay time between the PSD and REMPI lasers) = 1.5 and 2.0 μs, respectively, where the strongest H2 and D2 (J = 0 and 1) signals were obtained from the Al substrate. The scan step size of the REMPI laser is 0.001 nm and a typical duration to obtain a spectrum is around 60 s. In Figure 4, the H2 and D2 intensities increase and start to become saturated at around 30 minutes (1800 s). Since the multiple layers of solid H2 cannot be created at 8 K, this saturation indicates that the molecular coverage is reaching unity. Based on this plot, we consider the molecular H2 (D2) beam flux of about 1.2 × 1015 cm−2/1800 s ≈ 7 × 1011 cm−2 s−1 if we assume there is 1.2 × 10¹⁵ Al atoms cm−2 on the Al substrate (Wyckoff 1931). However, because the actual number of sites on the Al substrate cannot be specified, we approximate the flux to be 5 × 10¹¹ to 1 × 1012 cm−2 s−1.

Figure 4. Photodesorbed (a) H2 and (b) D2 intensities for J = 0 (circles) and 1 (triangles) from the aluminum substrate at 8 K with continuous deposition of molecules within 120 minutes through the beam line. The total (sum of J = 0 and 1) signal intensity is also shown (squares). Time of flight (the delay time between the PSD and REMPI lasers) = 1.5 and 2.0 μs for (a) H2 and (b) D2 molecules, respectively, where strong H2 and D2 (J = 0 and 1) signals were obtained from the aluminum substrate.
Download figure:
Standard image High-resolution imageNext, since the atomic beam contains undissociated H2 (D2) molecules, we estimate a lower limit to the dissociation fraction of molecules in the atomic beam as follows (for details, see Watanabe et al. 2010). Figure 5(a) shows time evolutions of the sum of H2 (J = 0 and 1) intensities photodesorbed from the Al substrate at 8 K as a function of deposition time for the H2 molecular beam (solid data points) and the H atomic beam (open data points) through the same beam line. The H2 (J = 0 and 1) intensities for atomic deposition are significantly lower than those for molecular deposition. Since the H2 intensities obtained in the atomic-beam deposition should result from undissociated H2 contained in the atomic beam and/or recombined H2 which remained on the surface, the difference in the H2 (J = 0 and 1) intensities between atomic and molecular depositions in Figure 5(a) indicates a lower limit to the dissociation fractions of H2 (D2) molecules. This was derived to be approximately 66% (and 69% for D2; unpublished data), and we estimated that the H (D)-atom flux is roughly equivalent to the flux of the molecular beam, 5 × 10¹¹ to 1 × 1012 cm−2 s−1.
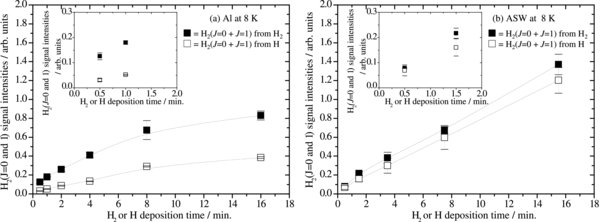
Figure 5. Time evolutions of the total H2 (sum of J = 0 and 1) signal intensities photodesorbed from (a) the aluminum (Al) substrate and (b) amorphous solid water (ASW) at 8 K as a function of deposition time for the H2 molecular beam (solid data points) and the H atomic beam (open data points) through the same beam line. Solid lines are guides for eyes. Time of flight = 1.5 μs, where strong H2 (J = 0 and 1) signals were obtained both from the Al substrate and ASW. The insets show the data within two minutes.
Download figure:
Standard image High-resolution imageOn the surface of hexagonal ice, there are about 1.0 × 10¹⁵ molecules cm−2 considering the lattice parameters (Petrenko & Whitworth 1999). We here assume that ASW has a 5–10 times greater surface area than that of a crystalline surface (Al-Halabi & van Dishoeck 2007; Hidaka et al. 2008). Thus, H (D)-atom deposition times of 30 and 360 s on ASW consequently lead to θ ≈ 1–5 × 10⁻³ and 2–7 × 10⁻², respectively, adopting the calculated sticking probability of 0.8–0.9 (Al-Halabi & van Dishoeck 2007).
3. RESULTS AND DISCUSSION
3.1. Recombination of H Atoms on ASW at 8 K
Evidence of significant recombination on ASW at 8 K is obtained with the following procedure. We performed the same series of measurements as described in Section 2.3; i.e., detection of H2 (J = 0 and 1) under continuous molecular or atomic deposition onto ASW. The results obtained at 8 K are shown in Figure 5(b).
As can be seen in Figure 5(b), only a slight difference in the H2 (J = 0 and 1) intensities was observed between molecular (solid data points) and atomic (open data points) deposition. Since the dissociation fraction of H2 molecules in the atomic beam was high (⩽∼66%), the slight difference indicates that monoatomic desorption is very minor: H atoms diffuse rapidly, and most of them recombine to form H2 molecules, and maybe are retrapped on the ASW surface at 8 K during atomic deposition in 30–360 s atomic deposition.
The insets in Figure 5(b) show that H atoms have already recombined to form H2 molecules even after 30 s of deposition of H atoms (corresponding coverage: θ ≈ 1–5 × 10⁻³) on the ASW surface at 8 K. The transient migration lengths of incident H atoms on the ASW surface (∼10 K) before the atoms are fully thermalized (hot atoms) have been calculated as ∼20, 60 ± 50, and ∼12 Å at Ti = 200 K (Buch & Zhang 1991), 100 K (Masuda et al. 1998), and 100 K (Al-Halabi & van Dishoeck 2007), respectively, where Ti is the translational temperature of the incident H atoms. If this is the case, then the hot-atom mechanism plays little role in H2 formation on the surface in the measurements for Figure 5(b). The recombination of H atoms to yield H2 molecules must be dominated by the Langmuir–Hinshelwood process.
In the present study, H2 (J = 2) was not detected from ASW at 8–15 K. It has been theoretically and experimentally demonstrated that H2 and HD molecules that are newly formed via recombination on low-temperature surfaces are in highly vibrationally and rotationally excited states for a formation energy of 4.5 eV (Takahashi 1999; Creighan et al. 2006; Yabushita et al. 2008a, 2008b). These two facts suggest that H2 molecules formed via recombination immediately reach thermal equilibrium with the ice temperature as they are retrapped on the ASW surface, which is consistent with the experimental results of Hornekær et al. (2003).
3.2. Diffusion of H and D Atoms on ASW and the Mechanism
Atoms were found to recombine efficiently on the ASW surface during deposition at 8 K (see Figure 5). On the other hand, some atoms survived on the ASW surface at 8 K even after atomic deposition. Figure 6 shows the time variations of the signal intensities of H and D atoms (IH and ID) photodesorbed from ASW or PCI as a function of the waiting time, t, after a deposition time of 360 s. IH and ID were measured at fixed delay times of the two lasers, TOF = 1.2 and 1.5 μs, at which the TOF profile of the two atoms peaked, respectively (see Figure 3). To obtain IH and ID, the REMPI spectra were acquired three times for each waiting time and those areas were added up. After the REMPI measurements, the ice sample was heated to 30 K to refresh the surface and cooled to 8 K again to continue the experiments.
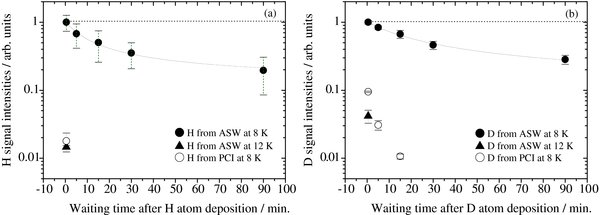
Figure 6. Attenuation of photodesorption intensities of (a) H atoms and (b) D atoms adsorbed on ASW at 8 K (solid circles) and 12 K (solid triangles) and PCI at 8 K (open circles) as a function of the waiting time after a deposition time of 360 s. Time of flight (TOF) = 1.2 and 1.5 μs for H and D atoms, at which the TOF profile of the two atoms peaked, respectively (see Figure 5). The solid lines in (a) and (b) are fits assuming Ediff = (a) 22 meV and (b) 23 meV at 8 K with Equation (2). The dotted lines in (a) and (b) are fits assuming Ediff = 30 meV at 8 K.
Download figure:
Standard image High-resolution imageIH and ID from ASW at 8 K (solid circles in Figure 6) decreased gradually as waiting time increased, while we successfully detected H and D atoms even after t = 90 minutes. When ASW was left for 90 minutes at 8 K without atomic deposition, the signals obtained due to the residual gas in the vacuum chamber were negligible. IH and ID from ASW at 12 K (solid triangles in Figure 6) became more than one order of magnitude lower than the equivalent values at 8 K. The H and D atoms were hardly detected from ASW at 15 K. IH and ID from PCI at 8 K also diminished immediately (open circles in Figure 6). The observed temperature and structural effects will be further discussed in Sections 3.4 and 3.5, respectively.
As described in Section 3.1, monoatomic desorption from ASW at 8 K would be very small, so that we consider that the attenuations of IH and ID on the ASW surface at 8 K after atomic deposition (solid circles in Figure 6) are caused mainly by recombination of the atoms following diffusion. (We did not observe unimolecular desorption of H2 molecules from the ASW surface at 8–15 K (see Figures 7 and 9 in the Appendix). These results support the assumption that the loss by monoatomic desorption is small at 8 K, at least for D atoms, if the rate of desorption is determined by the mass of the species.)
When the attenuation of H and D atoms on ASW is dominated by recombination, the surface number density of H (D) atoms, nH (cm−2), obeys the rate Equation (6) as described in Section 2.1,

Solving Equation (6), IH (ID) in Figures 6(a) and (b) can be fitted by Equation (7),

where I0 and n0 are the initial intensity and number density of H atoms, respectively. An asymptotic value, b, arises from the existence of H atoms that are long-lived even after 90 minutes of waiting time. Although we cannot derive kH–H and n0 independently, their product, kH–H n0, can be determined by fitting the data using Equation (7).
Observation of a significant isotope effect in the diffusion can be an indicator of quantum tunneling (Lauhon & Ho 2000). This is because the tunneling effect strongly depends on the particle mass. In the present study, both IH and ID decreased at a similar rate at 8 K (solid circles in Figure 6), however. Thus, we conclude that the diffusion of atoms that are detectable using the present experimental method is thermal hopping rather than tunneling. Using kH–H n0 obtained from Equation (7), θ ≈ 2–7 × 10⁻² and ν = 1012–1013 s−1, we determined Ediff = 22 ± 1 and 23 ± 1 meV for H and D atoms from Equation (5), respectively, by taking into account the errors on the fitted parameters. Some H and D atoms for a coverage of 2–7 × 10⁻² did not encounter each other within 90 minutes at 8 K (see Figures 6(a) and (b)). These results indicate the existence of energetically deep potential sites on the ASW surface in which the H (D) atoms are trapped. We estimated that the value of Ediff for a deep site should exceed approximately 30 meV, as shown by the dotted lines in Figures 6(a) and (b).
We could not determine the value of Ediff for very shallow sites on ASW at which atoms immediately recombine during deposition, as shown in Figure 5(b), but estimated an upper limit as follows. The diffusion coefficient, Dt (cm2 s−1), in a two-dimensional random walk can be expressed by

and

where tobs and dsite represent the observation time (s) and the distance to each site (cm), respectively, and 〈|x|2〉 is the mean-squared displacement (cm2). Figure 5(b) shows that H atoms have already recombined to form H2 molecules even after 30 s of deposition of H atoms (corresponding coverage: θ ≈ 1–5 × 10⁻³) on the ASW surface at 8 K. Assuming that tobs = 30 s, dsite2 = 10−15 cm2, 〈|x|2〉 = dsite2/θ = 2 × 10⁻¹³ to 1 × 10⁻¹² cm2, the lower limits to Dt and Ndiff at 8 K were then about 2–8 × 10⁻¹⁵ cm2 s−1 and 7–33 s−1, based on Equations (8) and (9), respectively. Although the origin of this rapid diffusion at the very shallow potential sites is not clear, i.e., whether it is due to tunneling or thermal hopping (see Section 3.3), assuming thermal hopping, an upper limit of Ediff for the very shallow site is estimated at 18 ± 2 meV from Ndiff and Equation (2).
3.3. Potential Sites on ASW for Diffusion of H and D Atoms
As described in the previous sections, there is an energetically wide range of potential sites on ASW, including very shallow potential sites (Ediff ⩽ 18 ± 2 meV) where the deposited H atoms diffuse rapidly and recombine efficiently on the ASW surface during atomic deposition at 8 K (see Figure 5), as well as middle and deep sites with energy depths of Ediff = 22 ± 1 and ⩾ ∼30 meV, respectively (see Figure 6).
To obtain further quantitative information about which of the potential sites is predominant on ASW, we studied the time variations of photodesorbed H2 (J = 0 and 1) signals from ASW as a function of waiting time after H2 or H deposition for 360 s was completed (θ ≈ 2–7 × 10⁻²). Figure 7(a) shows typical results obtained at 8 K. We observed a small difference in H2 (J = 0 and 1) intensities between molecular (solid data points) and atomic (open data points) depositions, which was also observed in Figure 5(b). In addition, the sum of the H2 (J = 0 and 1) signal intensities is kept almost constant for 10 minutes after H-atom deposition (open squares in Figure 7(a)), in spite of the fact that the H signal decreased within 10 minutes (see Figure 6(a)). Note again that, as described above, in the H-atom deposition, H2 signals were attributed to H–H recombination on the surface but not to the undissociated H2 in the atomic beam. Thus, if the detected H2 intensity arises mainly from the attenuation of H atoms (H2 formation by recombination) for around 10 minutes, as shown in Figure (6), then the H2 signal should increase for 10 minutes. However, this is not the case. That is, the H2 signals in Figure 7 mainly reflect H2 that was formed very rapidly during H deposition. As a result, we conclude that the ASW surface is dominated by very shallow potential sites where most H atoms can diffuse rapidly and recombine efficiently during atomic deposition (Ediff ⩽ 18 ± 2 meV). The middle- (22 ± 1 meV) and deep- (⩾ ∼30 meV) potential sites would be relatively small on the ASW surface, so that the number of H atoms at such sites should be small too. We were able to detect the H atoms there thanks to the high-detection sensitivity to atoms of the REMPI method. In addition, migration of H atoms into the bulk is unlikely on the ASW surface because the deposited H atoms efficiently diffuse on the ASW surface and recombine to yield H2 molecules before migration into the bulk. The H2 molecules that formed were retrapped on the ASW surface as shown in Figures 5(b) and 7(a).

Figure 7. Time variations of photodesorbed (a) H2 and (b) D2 intensities for J = 0 (circles) and 1 (triangles) from amorphous solid water (ASW) at 8 K as a function of waiting time after a deposition time of 360 s for the molecular beam (solid data points) and the atomic beam (open data points) through the same beam line. The total (sum of J = 0 and 1) signal intensity is also shown (squares). Solid lines are overlaid to aid the eye. Time of flight = 1.5 and 2.0 μs, where the strong H2 and D2 (J = 0 and 1) signals were obtained, respectively.
Download figure:
Standard image High-resolution imageWe also performed the above series of experiments for atomic and molecular deuterium under the same conditions as for hydrogen (see Figure 7(b)). Weaker D2 (J = 0 and 1) signals were obtained from ASW both in D2- and D-deposition experiments at 8 K compared to those for the H2 and H experiments (see Figure 7(a)). This can be explained by the difference in REMPI efficiency between hydrogen and deuterium. The ratio of the square of the two-photon transition moments for REMPI, |Mfo|2 H2(J = 0 and 1)/|Mfo|2D2(J = 0 and 1), is approximately 2.14 (Pomerantz et al. 2004). Table 2 summarizes the relative signal intensities of the sum of H2 or D2 (J = 0 and 1) obtained from H2, D2 and H, D depositions at 8 K. Since the lower limit to the dissociation fraction of D2 molecules is ∼69%, from Figure 7(b), Table 2, and the discussion above, it is clear that most D atoms diffuse efficiently at the very shallow sites and recombine to form D2 molecules during D-atom deposition, as well as H atoms. The sum of the D2 (J = 0 and 1) signal intensities is constant for 10 minutes after D-atom deposition (open squares in Figure 7(b)), indicating that the very shallow potential site is also dominant for diffusion of D atoms on the ASW surface.
Table 2. Relative Intensities of the Sum of H2 (J = 0 and 1) and D2 (J = 0 and 1) Obtained from H2 (D2) and H (D) Depositions on ASWa
| Ice Temperatures | H2 (J = 0 and 1) from | D2 (J = 0 and 1) from |
|---|---|---|
| H2 molecules:H atoms | D2 molecules:D atoms | |
| 8 K | 1.0 ± 0.1:0.8 ± 0.1 | 0.5 ± 0.1:0.3 ± 0.1 |
| (1.0 ± 0.1:0.6 ± 0.1)b | ||
| 15 K | 1.2 ± 0.1:0.7 ± 0.1 | 0.4 ± 0.1:0.3 ± 0.1 |
| (1.0 ± 0.1:0.6 ± 0.1)b | (1.0 ± 0.1:0.8 ± 0.1)b |
Notes. aEstimated lower limits to the dissociation fraction are 66% (H2) and 69% (D2). bThe value normalized to the signal intensities obtained from molecular depositions at each temperature.
Download table as: ASCIITypeset image
Ndiff and the diffusion coefficient of D atoms at the very shallow sites may be smaller than for H atoms because of the heavier mass of the D atoms, though the isotopic effect on the very fast diffusion of both H and D atoms could not be evaluated quantitatively in the present experiment. This is because both atoms have already recombined to form molecules during the deposition, and we could not evaluate the possibility of quantum tunneling.
The photodesorbed H2 intensities for J = 0 and 1 as a function of waiting time after H2 deposition at 8 K (solid triangles and circles in Figure 7(a)) show that the intensity of H2 (J = 1) decreases, while that of H2 (J = 0) increases at 8 K as the residence time on the ASW surface increases. Since the sum of the intensities of H2 (J = 0 and 1) was constant, these results indicate the nuclear spin conversion of H2 (J = 0 and 1) on the ASW surface at 8 K. The conversion was also observed at 15 K (see Figure 9 in the Appendix and Watanabe et al. 2010). The nuclear spin conversion of H2 (J = 0 and 1) will be further investigated in a forthcoming article.
3.4. Temperature Effect on the Diffusion of Atoms
As shown in Figure 6, the signal intensities of H and D atoms from ASW at 12 K (solid triangles) became more than one order of magnitude smaller than those at 8 K (solid circles). This result is significantly different from the relative signal ratio obtained from the TOF spectra of photodesorbed H atoms from ASW at 8–15 K during H-atom deposition (see Figure 3(a) and Table 1). Meanwhile, the relative signal intensities of the TOF spectra between 8 and 12 K are 1:0.42 and 1:0.76 for H and D atoms from ASW, respectively (see Table 1). These results indicate that, after H-atom deposition was halted, the H atoms present on the ASW surface at 12 and 15 K were much more rapidly consumed by recombination following fast diffusion compared with the situation at 8 K and/or when immediate monoatomic desorption became appreciable above 12 K. In the TOF spectra, D atoms tend to remain on the surface longer at relatively high temperatures compared to H atoms, both for ASW and PCI, presumably because of the different binding energies, Eb, between H and D atoms due to the zero-point energies (Buch & Czerminski 1991). To evaluate the recombination efficiency of H atoms on the ASW surface and monoatomic desorption at 15 K, we carried out time-variation experiments for H2 (J = 0 and 1) from ASW at 8 and 15 K after atomic or molecular deposition for 360 s (corresponding coverage: θ ≈ 2–7 × 10⁻²); the contribution of monoatomic desorption at 15 K can be estimated from the relative recombination efficiencies between 8 and 15 K.
Table 2 summarizes the relative signal intensities of the sum of H2 and D2 (J = 0 and 1) obtained at 8 and 15 K. The plots of experimental data at 15 K are shown in Figure 9 in the Appendix. For H2 deposition experiments, the total H2 (sum of J = 0 and 1) signal intensities obtained at 15 K were slightly higher than that at 8 K (1.2:1.0), as shown in Table 2. This small difference between 8 and 15 K may be caused by the difference in photodesorption efficiencies at 8 and 15 K. The ratios of the total H2 signal intensities between H2 and H depositions at 8 and 15 K are 1 (H2):0.8 (H) and 1 (H2):0.6 (H), respectively, as summarized in Table 2. When we take a lower limit to the dissociation fraction of H2 to be roughly 70% in the atomic beam, the fraction of undissociated H2 molecules is about 0.3. Thus, from Table 2, the lower limits of recombination efficiencies at 8 and 15 K are estimated at 0.8 − 0.3 = 0.5 and 0.6 − 0.3 = 0.3, respectively, indicating the occurrence of diffusion and recombination of H atoms at 15 K before monoatomic desorption.
These values should be lower limits because ejection of H2 molecules on recombination using heat of formation (4.5 eV) may occur to some extent. These values are fairly consistent with the recombination efficiencies on high-density amorphous ice reported by Vidali, Pirronello, and their coworkers (e.g., Vidali et al. 2006). The lower value at 15 K may be caused by the loss of H atoms by monoatomic desorption as well as ejection of H2 molecules upon recombination. The same discussion can be adapted to deuterium. Considering the lower limit to the dissociation fraction of D2 (∼69%) in the atomic beam, Table 2 and Figure 9 in the Appendix indicate that D atoms can also diffuse and recombine on the ASW surface at 15 K.
In our previous study, the H-atom intensities at 15 K after H-atom deposition on ASW were not as weak (of the same order) compared to those at 10 K (see Figure 3 in Watanabe et al. 2010). We found the reason for this is that the data were measured at the rising edge in the TOF spectrum of the H atoms in the previous experiment (see Figure 10 in the Appendix). In the present study, to obtain more quantitative information about potential sites on the ASW surface, we set the delay time between the PSD and REMPI lasers corresponding to the peak in the TOF spectra of the two atoms in Figure 6. Watanabe et al. (2010) confirmed the presence of H atoms on the ASW surface 90 minutes after H-atom deposition at 15 K, which gave a coverage of 10−3, and estimated Ediff for a deep site of 50 meV. The fraction of these very deep sites would be small compared with that of potential sites with an energy depth of Ediff = 30 meV.
3.5. Interactions on Polycrystalline Ice
Figures 3(b) and (d) show typical TOF spectra of photodesorbed H and D atoms from PCI. H and D signals from PCI almost disappeared at 15 K, indicating that the shallower potential sites where H atoms cannot be trapped at 15 K dominate the PCI surface compared to the ASW surface. When H and D atoms were deposited on PCI at 8 K for 360 s, the number of both H and D atoms on PCI diminished immediately (open circles in Figure 6). We could not obtain significant data for fits using Equation (7). Figure 6, however, also shows that the PCI surface only consists of very shallow potential sites, where more efficient diffusion of H and D atoms is expected.
We also studied the time variations of photodesorbed H2 (J = 0 and 1) signals as a function of waiting time after H2 and H deposition for 360 s on PCI. Figure 8(a) shows the typical results obtained at 8 K. The results for isotopic D2 or D experiments at 8 K are also shown in Figure 8(b). We see a decrease in the total signal intensities of both H2 (J = 0 and 1) and D2 (J = 0 and 1) at 8 K by unimolecular desorption after molecular deposition (solid data points in Figure 8), which is in contrast to the results from ASW (Figure 7). The same behavior was observed for the H2 and D2 (J = 0 and 1) signals obtained after we deposited H or D atoms on PCI at 8 K (open data points in Figure 8). It is thus difficult to evaluate recombination on PCI quantitatively. The sum of the H2 or D2 (J = 0 and 1) signals obtained at t = 0.5 minutes from the atomic depositions is, however, higher compared with the lower limit to the dissociation fraction (66% or 69%, respectively) implying that some recombined H2 (D2) remains on PCI for at least 0.5 minutes at 8 K. Hornekær et al. (2003) and Amiaud et al. (2007) investigated H+D or D+D recombination on nonporous ASW. Both studies showed that newly formed molecules on nonporous ASW are ejected into the gas phase. Similar reactions can be expected in PCI.
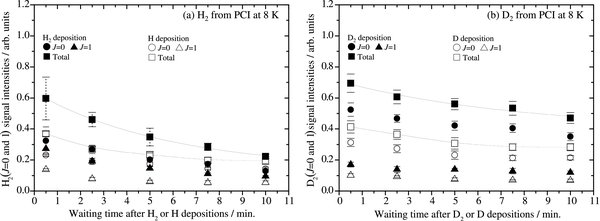
Figure 8. Time variations of photodesorbed (a) H2 and (b) D2 intensities for J = 0 (circles) and 1 (triangles) from polycrystalline ice (PCI) at 8 K as a function of waiting time after a deposition time of 360 s for the molecular beam (solid data points) and the atomic beam (open data points) through the same beam line. The total (sum of J = 0 and 1) signal intensity is also shown (squares). Solid lines are overlaid to aid the eye. The time of flight = 1.5 and 2.0 μs, where the strong H2 and D2 (J = 0 and 1) signals were obtained, respectively.
Download figure:
Standard image High-resolution imageMonoatomic desorption of H atoms is closely related to their binding energy, Eb (Eb is equivalent to the activation energy for desorption, Edes). Several theoretical studies of Eb for H atoms adsorbed on crystalline ice exist (Hollenbach & Salpeter 1970; Al-Halabi et al. 2002; Al-Halabi & van Dishoeck 2007). For example, Al-Halabi & van Dishoeck (2007) predicted that the adsorption probability of H atoms onto the crystalline surface is similar to that onto the ASW surface, and the average Eb of the trapped H atoms is 34 meV, with a full width at half-maximum of 10 meV. The residence time on crystalline ice was calculated to be 1.0 × 10⁵ s at 10 K (Al-Halabi & van Dishoeck 2007), which was longer than the present experimental timescale. In view of the observed unimolecular desorption of H2 and D2 molecules on PCI, however, monoatomic desorption of H and D atoms would contribute to the loss of H and D atoms on PCI to some extent, both during and after atomic deposition. If the desorption rate depends on the mass of the adsorbate, then the desorption rates may be comparable between H2 molecules and D atoms.
4. SUMMARY AND ASTROPHYSICAL IMPLICATIONS
We demonstrated that there is an energetically wide range of potential sites on ASW. Very shallow potential sites (Ediff ⩽ 18 ± 2 meV) are dominant on the ASW surface, where deposited H atoms diffuse rapidly and recombine efficiently during atomic deposition at 8 K (Figures 5 and 7), while there are also middle- (Ediff = 22 ± 1 meV) or deep- (Ediff ⩾ 30 meV) potential sites (Figure 6). Although the exact number of middle and deep sites is not clear, H atoms can already recombine to form H2 molecules at the very shallow sites on the ASW surface for a coverage of 1–5 × 10⁻³ to 2–7 × 10⁻² (Figures 5 and 7).
Little isotopic difference between H- and D-atom diffusion on ASW was found (Figure 6), indicating that thermal hopping better explains the diffusion mechanism instead of quantum tunneling, at least for the middle-potential sites.
The Ediff of 22 (23) meV obtained for the middle sites is consistent with the results of previous studies (Watanabe et al. 2010; Matar et al. 2008). As described in Watanabe et al. (2010), the outline of H2 formation on cosmic ice dust is roughly as follows. During the first stage, H atoms landed on the dust, diffuse rapidly at the abundant shallow and middle sites, and are finally trapped at the deep sites. Once a significant number of H atoms are trapped at the deep sites, the H atoms that arrive next recombine with such trapped H atoms. For a quantitative estimation, assume that a dust grain particle has ∼107 surface sites, a single H atom in a random walk can visit all middle sites within a few days, on average, at 10 K, and the required time for the H atom would be reduced if it goes through a very shallow site with Ediff ⩽ 18 meV. In reality, nonenergetic surface reactions of H atoms with other species can also be expected during diffusion on the ASW mantle.
It is widely recognized that H2O ice in dense molecular clouds is amorphous (e.g., Smith et al. 1989), while the nature of its morphology remains poorly known. Although it has been implied that amorphous ice in dense molecular clouds may have a large number of micropores, there have been no reports of the detection of dangling OH bonds in interstellar ices (Keane et al. 2001). Oba et al. (2009) first observed that there are no significant amounts of dangling bonds of OH in H2O formed through the pathway H+O2. Laboratory simulations observed that dangling OH bonds in ASW disappeared by UV irradiation and by energetic ion bombardment (Palumbo et al. 2010; Palumbo 2006). These observational and experimental studies suggest that it may have a compact (i.e., non-microporous) structure compared to the porous ASW prepared by vapor deposition in the present study. Previous studies reported that the average Eb of molecules or atoms for compact ice was lower than that for porous ice (Hornekær et al. 2003, 2005; Amiaud et al. 2007). The values of the Ediff estimated here may also be reduced for compact ASW. Smaller numbers of middle or deep sites are expected on compact ASW than those on the present ASW, implying that H atoms can diffuse rapidly on compact ASW. The efficiency of H2 formation on the ice surface depends not only on the diffusion of the H atoms, but also on the residence time of the H atoms. Amiaud et al. (2007) reported that the recombination efficiency of D atoms decreased to zero on nonporous ASW at 13 K because of the low residence time of atoms, while the present study and Hornekær et al. (2003) showed efficient recombination of H atoms on porous ASW at 15 K. The morphology of ice mantles should play a crucial role in interstellar H2 formation especially when T ≈ 15 K.
The very shallow potential sites also dominate the diffusion of D atoms on the ASW surface on which most of the atoms diffuse efficiently and recombine to form D2 molecules during D-atom deposition (see Figure 7(b)). The estimated Ndiff for D atoms among the middle potential sites on the ASW surface was smaller than that for H atoms by a factor of approximately 4 at 8 K from Equation (2), while D atoms can also diffuse to find other species adsorbed on the ASW surface. The present result can be fundamental information to understand the finer details of the reaction dynamics of H and D atoms on the ASW mantle, e.g., the reaction efficiencies of hydrogenation and deuteration reactions, and H–D substitution reactions, which are necessary to verify the respective importance of gas-phase versus solid-phase processes in the formation of interstellar deuterated species.
This work was supported by a Grant-in-Aid from the Japan Society for the Promotion of Science. The authors thank Dr. Y. Oba for useful suggestions regarding the morphology of water ice in molecular clouds.
APPENDIX
A.1. Photo-stimulated Desorption Mechanism
Since the absorption coefficient of water ice is known to be negligibly small for photons at 532 nm (⩽10−3 cm−1) (Grenfell & Perovich 1981), photodesorption may be induced from the Al surface; propagation of phonons from the substrate is a possible source. In fact, ice thickness dependence on the signal intensities of TOF spectra for photodesorbed H atoms from ASW at 8 K was studied for vapor-deposition times of 84–4200 s (6–316 L); the intensities decreased as the ice thickness increased, and almost disappeared for 4200 s deposition (316 L). Several PSD mechanisms have also been proposed for physisorbed molecules on cryogenic surfaces (Fukutani et al. 2005).
We now evaluate the possibility of laser-induced thermal diffusion. The optical depth (the depth to which the transmission drops to 1/e = 37%) of the Al substrate is ∼7 nm (Hagemann et al. 1975). Assuming a square incident laser pulse with a pulse width of τin seconds, the maximum temperature rise of the Al substrate surface, ΔT(tin), can be estimated using Equation (A1) (Osmundsen et al. 1985),
I (1 − R) (1 − 1/e) is the laser intensity (J s−1 cm−2) absorbed at the Al substrate surface at the optical depth. I and R are the incident laser intensity and the reflectivity of the Al substrate surface, respectively; 2 (βτin/π)1/2/κ (J−1 s cm2 K) effectively means the inverse of the heat-transfer coefficient, where β and κ are the thermal diffusivity (cm2 s−1) and thermal conductivity (J s−1 cm−1 K−1), respectively. For the Al substrate, the reflectivity R = 0.916 (Hass 1955). From the relation β = κ/ρc, where ρ and c are the density (g cm−3) and heat capacity (J g−1 K−1), respectively, we derived β for the Al substrate at 8 K to be 24+12−6 (cm2 s−1), when taking κ = 0.1 (J s−1 cm−1 K−1), ρ = 2.8 (g cm−3), and c = (1.5 ± 0.5) × 10−3 (J g−1 K−1) at 8 K (Woodcraft 2005; Ekin 2006). In the present case, I = 7 × 10⁴ (J s−1 cm−2), τin = 4 × 10⁻⁹ (s), and the maximum temperature rise was estimated to be about 13+3−2 K in 7 nm of the Al substrate surface. If the ASW surface immediately reaches thermal equilibrium with the Al substrate from 8 K to ∼24 K, then Equation (2) gives only 1−10 hops of atoms during τin = 4 × 10⁻⁹ s at the very shallow site with Ediff = 18 meV, even ignoring desorption of atoms. In fact, since heat is dissipated within bulk ice and the thermal conductivity of ASW is extremely low (Kouchi et al. 1992), the temperature of the ASW surface would not reach 24 K. If Ediff at the very shallow site is less than 18 meV, then atoms recombine within 30 s of deposition before the PSD experiment, as discussed in Section 3.2. Thus, we consider that laser-induced thermal diffusion does not play a dominant role in the recombination of atoms at very shallow sites in Figure 5(b).
A.2. Time Variations of Photodesorption Intensities for H2 and D2 molecules from ASW at 15 K as a Function of Waiting Time
Figure 9 shows time variations of photodesorbed (a) H2 (J = 0 and 1) and (b) D2 (J = 0 and 1) signals as a function of waiting time after molecular (solid data points) or atomic (open data points) depositions for 360 s on ASW at 15 K. The sum of the H2 and D2 (J = 0 and 1) intensities are also plotted.

Figure 9. Time variations of photodesorbed (a) H2 and (b) D2 intensities for J = 0 (circles) and 1 (triangles) from amorphous solid water (ASW) at 15 K as a function of waiting time after a deposition time of 360 s for the molecular beam (solid data points) and the atomic beam (open data points) through the same beam line. The total (sum of J = 0 and 1) signal intensity is also shown (squares). Solid lines are overlaid to aid the eye. Time of flight = 1.5 and 2.0 μs, where the strong H2 and D2 (J = 0 and 1) signals were obtained, respectively.
Download figure:
Standard image High-resolution imageA.3. Temperature Dependence of H-atom Diffusion Measured at Different Times of Flight
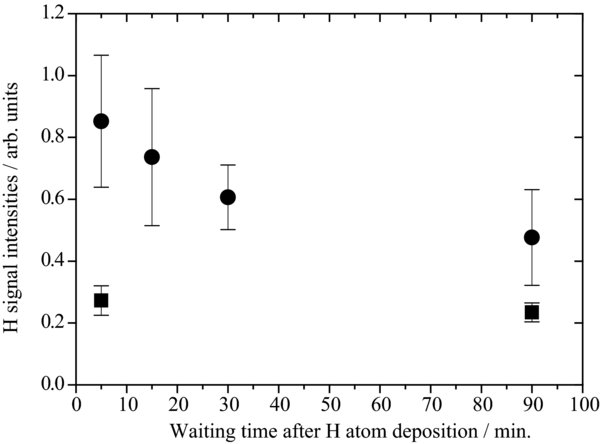
We have reproduced the data of Figure 3 in Watanabe et al. (2010) by measuring at TOF = 0.5 μs, corresponding to the rising edge in the TOF profile of H atoms. Figure 10 shows the attenuation of the photodesorption intensities of H atoms from ASW at 8 K (solid circles) and 15 K (solid squares) as a function of the waiting time after deposition for 360 s with a chopper disk. The power of 532 nm for PSD was ∼80 μJ pulse−1, which was the same as used in Watanabe et al. (2010). TOF = 0.5 μs corresponds to the rising edge in the TOF spectra of H atoms. To obtain more quantitative information about potential sites on the ASW surface, we set TOF = 1.2 and 1.5 μs for H and D atoms in the present study, respectively, which corresponds to the peak in the TOF spectra of the two atoms shown in Figure 3.
Figure 10. Attenuation of photodesorption intensities of H atoms adsorbed on ASW at 8 K (circles) and 15 K (squares) as a function of the waiting time after a deposition time of 360 s with a chopper disk. The time of flight (TOF) = 0.5 μs, which corresponds to the rising edge in the TOF spectra of H atoms.
Download figure:
Standard image High-resolution image