


ABSTRACT
New solar extreme-ultraviolet (EUV) irradiance observations from the NASA Solar Dynamics Observatory (SDO) EUV Variability Experiment provide full coverage in the EUV range from 0.1 to 106 nm and continuously at a cadence of 10 s for spectra at 0.1 nm resolution and even faster, 0.25 s, for six EUV bands. These observations can be decomposed into four distinct characteristics during flares. First, the emissions that dominate during the flare's impulsive phase are the transition region emissions, such as the He ii 30.4 nm. Second, the hot coronal emissions above 5 MK dominate during the gradual phase and are highly correlated with the GOES X-ray. A third flare characteristic in the EUV is coronal dimming, seen best in the cool corona, such as the Fe ix 17.1 nm. As the post-flare loops reconnect and cool, many of the EUV coronal emissions peak a few minutes after the GOES X-ray peak. One interesting variation of the post-eruptive loop reconnection is that warm coronal emissions (e.g., Fe xvi 33.5 nm) sometimes exhibit a second large peak separated from the primary flare event by many minutes to hours, with EUV emission originating not from the original flare site and its immediate vicinity, but rather from a volume of higher loops. We refer to this second peak as the EUV late phase. The characterization of many flares during the SDO mission is provided, including quantification of the spectral irradiance from the EUV late phase that cannot be inferred from GOES X-ray diagnostics.
Export citation and abstract BibTeX RIS
1. INTRODUCTION
The recently launched NASA Solar Dynamics Observatory (SDO) has three solar instruments on board to study the radiative output, magnetic field, and variability of the solar plasma with high time cadence. The extreme-ultraviolet (EUV) irradiance instrument, named the EUV Variability Experiment (EVE), measures the solar irradiance (full-disk radiation). The solar irradiance is the major energy driver of Earth's upper atmosphere and is a key variable in understanding a variety of planetary and heliophysical phenomena. Solar irradiance measurements also show the variability of the solar radiation over all timescales ranging from minutes to decades and can provide calibration for some solar physics spectrographs and imagers. The high cadence (10 s) and modest spectral resolution (0.1 nm) for SDO EVE is also valuable for examining the spectral variations during flare events. While EVE observations provide full-disk spectra, the irradiance variations during many of the flare events have corresponded to flaring in a single active region (AR) as confirmed by examining the SDO Atmospheric Imaging Assembly (AIA; Lemen et al. 2011) solar EUV images. Therefore, an EVE spectrum minus the pre-flare spectrum provides a flare spectrum over the full EUV range when only one dominant flare event is in progress at a time. The EVE spectra over the full EUV range, EUV images from AIA, and magnetic fields from the SDO Helioseismic and Magnetic Imager (HMI) provide a powerful combination to study flare processes.
Solar flares have long been an interest for sudden ionosphere disturbances and their effect on radio communication (e.g., Dellinger 1937). Flare observations have been made for decades in the visible, primarily in Hα (e.g., Ellison 1946), and also in the X-ray and EUV ranges from sounding rocket and satellite experiments (e.g., Friedman 1963). Hudson (2010, 2011), Doschek & Feldman (2010), Lang (2009), and Aschwanden et al. (2009b) provide reviews of recent progress in understanding flares from observations that involve SOHO, TRACE, RHESSI, Hinode (Solar-B), and STEREO missions. These satellites include imagers in X-ray and EUV broadbands and imaging spectrographs with high spectral resolution but limited EUV range. The new and exciting aspects of the SDO EVE observations for flare studies are the spectral coverage over the full EUV range from 0.1 to 106 nm with 0.1 nm resolution and the continuous monitoring of the solar activity with a high cadence of 10 s.
The new irradiance observations by EVE are significantly improved over the previous solar EUV irradiance instruments flying on SOHO, TIMED, and GOES spacecraft. The EVE suite includes MEGS which provides EUV spectral observations with spectral resolutions of 0.1 nm from 6 to 105 nm, a cadence of 10 s, and an accuracy to better than 20%. The EUV SpectroPhotometer (ESP) provides broadband observations between 0.1 and 39 nm with an even higher cadence of 0.25 s and with an improved accuracy of better than 10%. Woods et al. (2010) provide an overview of EVE's science plans, instrument design, and data products. Didkovsky et al. (2010) provide an overview of the ESP instrument and its calibration, and Hock et al. (2010) provide an overview of the MEGS instrument and its calibration. SDO was launched on 2010 February 11, and EVE began normal operations on 2010 May 1.
The flare data from EVE shown here are primarily from the MEGS-A channel measuring the spectrum from 7 to 37 nm and the ESP zeroth-order channel (0.1–7 nm band) as the flare variations are most evident in these wavelengths. The EVE spectral resolution of 0.1 nm is especially significant for the wavelength range from 7 to 27 nm because previously there have only been broadband (∼10 nm wide) EUV irradiance measurements at these wavelengths. With EVE's improved spectral resolution and continuous observations with 10 s cadence and in conjunction with AIA EUV images and HMI magnetic fields, we now have a much more accurate knowledge of how the solar EUV irradiance varies during flare events. While not discussed here, the EVE spectra have better than anticipated wavelength stability, and Doppler shifts are evident in the EVE spectra, both for the ±3 km s−1 drift over its 24 hour orbit period and during some flare events (Hudson et al. 2011).
Flares are often decomposed into an impulsive phase with significant non-thermal signatures and a gradual (slow) mostly thermal phase that follows the impulsive phase (Donnelly 1976; Hudson 2010, 2011). The rapid release of energy from magnetic reconnection in the corona accelerates electrons and ions during the impulsive phase, which is often dominated by intense bremsstrahlung radiation in the hard X-ray (HXR) from the energetic electrons as they interact with the dense, cool plasma in the solar chromosphere and transition region. These energetic particles heat the chromosphere, and the evaporated plasma rises into the corona during the gradual phase while emitting much of its radiation in the soft X-rays (SXRs) and EUV range. This is part of an overall process of cooling the hot plasma in progressively higher post-flare loops that are an indication of magnetic reconnection (e.g., Kopp & Pneuman 1976; Svestka 1989; Raftery et al. 2009). The gradual component normally peaks a few minutes after the impulsive phase, and its intensity rise can often be approximated as the time integral of the impulsive component, referred to as the Neupert effect (Neupert 1968). The magnetic reconnection process can be fast, so some flare models have many flaring loops, or strands within such coronal loops, heated at slightly different times to form a continuous source (Warren & Doschek 2005). In addition to these standard flare components of the impulsive phase and gradual phase, Hudson (2011) notes two extra flare phases based on HXR variations: the onset phase of enhanced HXR and SXR radiation prior to the impulsive phase (e.g., RHESSI flare data in Lin et al. 2003) and the extended phase of additional HXR radiation many minutes after the impulsive phase but within the same time frame as the gradual phase of the SXR variations (e.g., HXR bursts in Cliver et al. 1986).
When discussing the flares, we will usually distinguish them as being confined or eruptive flares (e.g., Svestka & Cliver 1992). A confined flare does not change the overlying magnetic structure in the flaring region (Aschwanden et al. 2009b); whereas an eruptive flare, also named a dynamic flare by Svestka (1989), has mass leaving the flaring region as seen in solar EUV and X-ray images and frequently also has a coronal mass ejection (CME) as seen by a white-light coronagraph. In most cases the smaller, compact flares are confined flares, while the larger and two-ribbon flares are more commonly eruptive flares, up to the largest flares which are predominantly eruptive. Long-duration flares, also called long decay events (LDEs) by Kahler (1977), are usually associated with eruptive two-ribbon flares.
2. EVE FLARE OBSERVATIONS
During the first year of SDO normal operations, which started on 2010 May 1, there were 474 C-class (more common, smaller) flares, 46 M-class (moderate) flares, and 2 X-class (extreme) flares. Most of these flares occurred during the intense solar storm period in 2011 February–March; only 96 of these flares occurred in 2010. The flare classification is based on GOES whole Sun (or integrated) X-ray 0.1–0.8 nm measurements, which have been made for more than 30 years. The flare magnitude is defined for the X-ray peak with a letter and a number. The logarithmic letter scale uses A, B, C, M, and X for ascending orders of magnitude, and the number scale is linear. For example, an M2 flare is 20 times brighter than a C1 flare (that corresponds to a peak irradiance of 1 μW m−2).
Of these 522 X-ray flares, 191 flares have been analyzed and classified according to analysis of the EVE solar EUV irradiance and with AIA and HMI images. The flare variations in the EUV are barely detectable by EVE in many EUV emissions until the X-ray flare peak is above a magnitude of C2. Table 1 lists a summary of the flare results. A flare catalog based on EVE observations is provided in Hock et al. (2011).
Table 1. Summary of Flares
| Flare | GOES | Flares | Impulsive | Coronal | EUV |
|---|---|---|---|---|---|
| Class | X-ray | Analyzed | Phase | Dimming | Late Phase |
| C1–C9 | 474 | 169 | 90 | 29 | 16 |
| M1–M9 | 46 | 21 | 16 | 12 | 9 |
| X1–X10 | 2 | 1 | 0 | 1 | 0 |
| Total | 522 | 191 | 106 | 42 | 25 |
Notes. The flares analyzed for this paper were only flares with good viewing of the post-flare loops in AIA images. The analysis of impulsive phase, coronal dimming, and EUV late phase is based on EVE measurements of the He ii 30.4 nm, Fe ix 17.1 nm, and Fe xvi 33.5 nm emissions, respectively.
Download table as: ASCIITypeset image
From examining the dozens of EUV emission lines in the EVE spectra during flare events, there are four primary aspects of the flares that dominate the EUV time series: (1) an HXR impulsive phase, (2) a (X-ray/EUV) gradual phase, (3) an EUV coronal dimming often associated with CMEs, and (4) an EUV late phase which will be explained later in Section 3. Because our flare selection process first starts with identifying flares in the GOES X-ray time series, all of our flares have the gradual phase component. The other EUV flare components are not always present, but these components are more common for eruptive flares. The C8.8 flare on 2010 May 5 is a good example when all four components clearly exist as shown in Figure 1. The various EUV emissions have one or more of these aspects in their time series, and the four emissions that best highlight each component are included in this figure and for discussion throughout the paper. The EUV spectral variations during this C8.8 flare are shown in Figure 2, and Table 1 lists a summary of the flares by X-ray class (C, M, or X).

Figure 1. Flare variations for the C8.8 flare on 2010 May 5. The relative irradiance (Rel. Irr.), being the solar irradiance spectrum minus the pre-flare spectrum, represents well the flare variations over its different phases. The transition region He ii 30.4 nm emission highlights the impulsive phase. We assume that GOES X-ray defines the gradual phase, and the hot corona Fe xx/Fe xxiii 13.3 nm emission behaves almost identically as the X-ray. The cool corona Fe ix 17.1 nm emission is the EUV emission with the largest amount of coronal dimming after the impulsive phase. The warm corona Fe xvi 33.5 nm emission has its first peak a few minutes after the X-ray gradual phase peak and then has a second peak many minutes later. The change in slope of the GOES X-ray during the gradual phase is indicative of the late phase contribution (second Fe xvi peak). The four vertical dashed lines, left to right, are for spectra in Figure 2 of the pre-flare, main phase, coronal dimming, and EUV late phase.
Download figure:
Standard image High-resolution image
Figure 2. Flare spectral variations from the EVE MEGS-A channel (6–37 nm) for the C8.8 flare on 2010 May 5. Panel (a) shows the pre-flare spectrum. Panels (b)–(d) show the variability between the pre-flare irradiance and the main phase, coronal dimming, and EUV late phase, respectively. These results used five-minute averages taken at the times indicated in Figure 1 as vertical dashed lines.
Download figure:
Standard image High-resolution imageThe He ii 30.4 nm emission is from the transition region, and it contributes more energy than any other single emission in the EUV range during a flare (see Figure 2(b)). If the flare has a strong impulsive phase, then the He ii emission has a peak a few minutes before the X-ray peak and sometimes a second peak soon after the X-ray peak corresponding to post-flare loop reconnections. This emission sometimes does not exhibit an impulsive phase contribution and just has enhancements during the post-flare loop reconnections. Based on the timing of the He ii peak, 55% of the flares in our sample had a strong impulsive phase. The impulsive phase is important for a myriad of space weather applications because of its indication of the start of the flare event and the possibility of highly energetic radiation and particles that can be created during the impulsive phase. The energetic radiation can include the non-thermal bremsstrahlung radiation (HXR) and sometimes gamma rays that reach Earth in eight minutes. Furthermore, the brighter flares are sometimes associated with solar energetic proton events that reach Earth in a few hours and CME events that reach Earth in a couple of days.
The Fe xx/Fe xxiii 13.3 nm emission represents the hot corona at 10–16 MK, and this emission behaves very similar to the GOES X-ray time series and represents well the flare's gradual phase. This emission is an excellent proxy for the SXR and vice versa. The gradual phase is characterized as the chromospheric evaporation resulting from the initial heating caused during the impulsive phase. The intense increase in SXR and EUV radiation in the 0.1–15 nm range during the gradual phase, as shown in Figure 2(b), is important for space weather applications as they are energetic enough to quickly enhance the ionization in Earth's upper atmosphere (80–300 km). Furthermore, the gradual phase typically lasts for many minutes to even hours and thus impacts Earth's atmosphere for a longer period of time than the impulsive phase.
A third EUV emission included in Figure 1 is the Fe ix 17.1 nm emission that represents the cool corona at 0.7 MK. If there is coronal dimming, then the Fe ix through Fe xiv emissions usually show it. For this example flare in Figure 1, the Fe ix emission has a large decrease as shown in Figure 2(c). The decrease of the Fe ix coronal emission starts near the peak of the impulsive phase, and this emission usually reaches its minimum after the peak of the Fe xx/Fe xxiii emission and sometimes not until after the first peak of the Fe xvi 33.5 nm emission, as is the case in Figure 1. The duration of the coronal dimming can be a few hours to a day or so (Rust 1983; Sterling & Hudson 1997; Reinard & Biesecker 2008). The Fe ix emission showed coronal dimming for 22% of the flares analyzed. The importance of the coronal dimming to space weather is that it is highly correlated with CME events (e.g., Rust 1983; McIntosh et al. 2007). This is indeed the case for these Fe ix coronal dimmings as compared to CMEs detected by coronagraphs aboard SOHO and STEREO.10 Aschwanden et al. (2009a) have shown that the amount of coronal dimming can be used to derive CME characteristics such as mass, so the near real-time EVE Fe ix 17.1 nm data have potential application for providing alerts of CME events. How the EVE Fe ix coronal dimmings relate to the CME parameters is not yet understood but will surely be studied in detail with the many flares already observed during the SDO mission.
The warm corona emission in Figure 1 is the Fe xvi 33.5 nm emission which represents a coronal temperature of about 3 MK. Being cooler than the Fe xx, the Fe xvi emission peaks, on average, 6 minutes after the Fe xx and GOES X-ray peak, and this time delay indicates the cooling rate of the post-flare coronal loops in the volume involved in the impulsive and gradual phases. For LDE flares, the delay for the Fe xvi gradual phase peak is even longer, ranging up to two hours for the C3.4 flare on 2010 November 3 (X-ray peak at 13:08 UT). For the 2010 August 1 LDE (C3.2 flare), the delay for the Fe xvi gradual phase peak was 101 minutes. The Fe xv and Fe xvi emissions are also interesting as they sometimes have a second peak, and their irradiance during the second peak is often similar in magnitude as the first peak. This second peak of the Fe xvi (and also Fe xv) emissions occurred about 13% of the time. When there is a second peak, the second peak occurred between 41 and 204 minutes after the first peak during the gradual phase, with an average delay of 100 minutes. In addition, the ratio of the second peak to the first peak ranged from 0.2 to 4.1; the average ratio is 0.8. The importance of these second peaks to space weather is just now being studied in ionosphere–thermosphere models, but it is clear that they contribute to ionization in Earth's atmosphere for even longer than the first peak during the gradual phase. Section 3 discusses the importance of this second peak which we refer to as the EUV late phase.
There are dozens of other emission lines in the EUV spectra with several being blends for EVE's 0.1 nm spectral resolution, but these four emission lines selected for Figure 1 represent reasonably well how the other EUV emission lines behave. In particular, the cool coronal Fe ix, Fe x, and Fe xi emissions vary similarly, and the warm coronal Fe xv and Fe xvi emissions have similar variations. The moderately warm coronal Fe xii, Fe xiii, and Fe xiv emissions vary about the same as each other and have the character of coronal dimming similar to the Fe ix emission. Both the much cooler transition region emissions such as the He ii 30.4 nm (∼0.08 MK) and hot coronal emissions Fe xx/Fe xxiii 13.3 nm (10–16 MK) emissions, shown in Figure 1, exhibit their largest increases during the flare's main phase, as do the X-ray measurements, but no significant variations after the flare main phase.
The GOES X-ray emission is also included in Figure 1 as it has sometimes been used as a proxy for the short-term variations of the solar EUV irradiance (e.g., Chamberlin et al. 2008). We note that the GOES X-ray emission correlates well with the very hot coronal emissions and that the time derivative of the GOES X-rays (Neupert effect) correlates reasonably well with the transition region emissions, but the GOES X-ray emission in either form does not correlate well with the variations seen in the other coronal emission lines (∼0.7–5 MK), so additional studies for how to best model these coronal emissions during flares are needed for space weather applications.
For the flare statistics as noted above, the flare components were specially defined as follows, so that all the flares would be analyzed consistently. The impulsive phase starts with the rise of the He ii 30.4 nm emission and ends when the GOES X-ray reaches its peak. Alternatively, one could use the RHESSI HXR time series to clarify the timing of the impulsive phase, or one could also use the start of the GOES X-ray as the start of the impulsive phase. Our gradual phase is defined by the start and end of the GOES X-ray increase during each flare, and often our gradual phases overlap in time with the other flare components. The hot coronal emissions, such as the Fe xx/Fe xxiii 13.3 nm emission, are also good indicators of the gradual phase. The coronal dimming period is based on the Fe ix 17.1 nm emission decreasing near the time of the impulsive phase peak and staying lower than its pre-flare level. Other cool coronal emissions of Fe ix to Fe xii also indicate coronal cooling. Finally, the period of the EUV late phase is defined as starting at the minimum between the first and second peaks of the Fe xvi 33.5 nm emission and ending when this emission returns to its pre-flare level. Other Fe xv and Fe xvi emissions could also be used to identify EUV late phases. As discussed in Section 3, there are additional requirements for the EUV late phase than just having two peaks.
One of the early surprises for the SDO mission was that 65% of the C-class and brighter flares in 2010 May–August were associated with CMEs. Earlier studies revealed what appeared to be a steady increase in the fraction of CME-related events as a function of flare magnitude, ranging from ∼20% for C flares to ∼50% for M flares, and reaching close to 100% for X flares (Andrews 2003; Wang & Zhang 2007; Yashiro et al. 2005; Hudson 2011). One difference between our sample and the data studied by the above references is that the Sun in 2010 was still very inactive and in a low cycle (Pesnell 2008), with few ARs and no large ones, while the earlier studies were based on events during the rise and maximum phases of the solar cycle. Now that there have been hundreds of flares during the SDO mission and also larger ARs, the number of flares associated with CMEs during the SDO mission is more consistent with the earlier results, in particular 17% for C flares, 57% for M flares, and 100% for X flares.
3. EUV LATE PHASE
We define four criteria for the EUV late phase: (1) a second peak of the warm coronal emissions (Fe xv and Fe xvi) several minutes to a few hours after the GOES X-ray peak, (2) no significant enhancements of the GOES X-ray or hot coronal emissions (e.g., Fe xx/Fe xxiii 13.3 nm) during this second peak (we consider <10% of its gradual phase peak "not significant"), (3) an eruptive event as seen in the AIA images, as a CME in white light, and/or as coronal dimming in the Fe ix 17.1 nm emission, and (4) a second set of longer loops that are higher than the original flaring loops and at a much later time than the first set of post-flare loops formed just minutes after the flare, as observed in AIA images. Our definition of the EUV late phase is based on clear differences between flare variations in the GOES X-ray and the delayed variations undetected in X-rays but significant and visible in the EUV. Furthermore, the EUV late phase is distinctly different from the gradual phase that includes the cooling of post-flare loops and the simultaneous heating and increase of the EUV emission in a separate set of post-eruptive loops of longer length than the compact flare loops, as confirmed with AIA images. The warm coronal emissions with formation temperatures near 3 MK, such as the Fe xvi 33.5 nm emission, exhibit the EUV late phase (second peak) phenomenon the best as illustrated in Figure 1. The flares of magnitude C2 or larger and with an EUV late phase are listed in Table 2. It is interesting to note that about half of the EUV late phase flares are from AR 11069 in 2010 May and AR 11121 in 2010 November, so the magnetic field configuration of the AR also appears to be important for the EUV late phase.
Table 2. List of EUV Late Phase Flares Brighter Than C2 during May 2010–March 2011
| Time | GOES X-ray | Flare Information | CME Information | |||||||||
|---|---|---|---|---|---|---|---|---|---|---|---|---|
| Date | DOY | Flare Class | Peak Time | Location on Disk | NOAA Active Region | Eruptive in AIA images? | White Light CME? | Onset | CME | Instrument | Width (deg) | Avg. Velocity (km/s) |
| 1-May-10 | 121 | C5.7 | 01:39 | N23E73 | 11067 | Yes | Yes | 1:24 | 106 | COR2A | 42 | 379 |
| 4-May-10 | 124 | C3.6 | 16:29 | N41W23 | 11069 | Yes | Yes | 18:24 | 307 | COR2B | 8 | 624 |
| 5-May-10 | 125 | C2.3 | 07:16 | N42W33 | 11069 | Yes | No | |||||
| 5-May-10 | 125 | C8.8 | 11:52 | N42W35 | 11069 | Yes | Yes | 15:08 | 310 | COR2B | 12 | 568 |
| 5-May-10 | 125 | M1.2 | 17:19 | N42W37 | 11069 | Yes | Yes | 16:54 | 35 | COR2A | 20 | 657 |
| 8-May-10 | 128 | C9.3 | 04:59 | N38W65 | 11069 | Yes | Yes | 5:30 | 310 | C2 | 33 | 622 |
| 8-May-10 | 128 | C2.4 | 20:11 | N38W65 | 11069 | Yes | Yes | 19:31 | 312 | C2 | 37 | 447 |
| 13-Jun-10 | 164 | M1.0 | 05:39 | S25W84 | 11079 | Yes | Yes | 6:30 | 250 | C2 | 75 | 349 |
| 9-Jul-10 | 190 | C3.4 | 19:51 | N19E72 | 11087 | Yes | Yes | 20:54 | 48 | C2 | 37 | 187 |
| 16-Oct-10 | 289 | M2.9 | 19:07 | S20W26 | 11112 | Yes | Yes | 20:12 | 271 | C2 | 32 | 350 |
| 3-Nov-10 | 307 | C3.8 | 06:11 | S20W90 | 11121 | No | Yes | 05:24 | 79 | COR2A | 48 | 582 |
| 3-Nov-10 | 307 | C4.9 | 12:21 | S20W90 | 11121 | Yes | No | |||||
| 4-Nov-10 | 308 | M1.6 | 23:58 | S20E56 | 11121 | Yes | No | |||||
| 5-Nov-10 | 309 | M1.0 | 13:29 | S20E56 | 11121 | No | No | |||||
| 6-Nov-10 | 310 | M2.5 | 16:10 | S18E44 | 11121 | Yes | No | |||||
| 7-Nov-10 | 311 | C5.4 | 01:41 | S18E34 | 11121 | Yes | No | |||||
| 15-Nov-10 | 319 | C2.3 | 07:49 | N12W22 | 11124 | Yes | No | |||||
| 22-Jan-11 | 022 | C2.4 | 08:28 | N18W19 | 11149 | No | Yes | 09:24 | 269 | COR2B | 32 | 357 |
| 28-Jan-11 | 028 | M1.3 | 01:03 | N16W91 | 11149 | Yes | Yes | 01:24 | 325 | COR2A | 148 | 357 |
| 9-Feb-11 | 040 | M1.9 | 01:31 | N17W72 | 11153 | Yes | No | |||||
| 24-Feb-11 | 055 | M3.5 | 07:35 | N28E90 | 11161 | Yes | No | |||||
| 8-Mar-11 | 067 | M5.3 | 10:44 | S17W86 | 11165 | Yes | No | |||||
| Date | Flare class | Coronal Dimming | EUV Late Phase (ELP) Information | EVE QEUV (0-45 nm) | ||||||
|---|---|---|---|---|---|---|---|---|---|---|
| Coronal Dimming? | Depth (μW/m2) | Dimming (min) | Main Peak Time/ ELP Peak Time/ ELP Delay | Pre-flare Irr/ Main Peak Irr/ % Increase | ELP Peak Irr./ %Increase/ Ratio ELP/Main | Start Time/ ELP Start/ ELP End Time | Pre-flare Q/ Main Peak Q/ % Increase | Ratio of ELP Energy to Main Phase Energy | ||
| 01:43 | 11.7 μW/m2 | 13.1 μW/m2 | 01:28 | 1.99 mW/m2 | ||||||
| 1-May-10 | C5.7 | No | 02:24 | 12.1 μW/m2 | 12.0% | 01:52 | 3.05 mW/m2 | 0.56 | ||
| 41 min | 2.9% | 4.17 | 02:46 | 53% | ||||||
| 16:33 | 12.4 | 15.0 | 16:19 | 2.08 | ||||||
| 4-May-10 | C3.6 | Yes | −1.13 | 162 | 17:50 | 14.6 | 21.1% | 16:58 | 2.87 | 0.85 |
| 77 | 18.2% | 1.16 | 18:41 | 38% | ||||||
| 07:20 | 12.4 | 13.7 | 07:09 | 2.05 | ||||||
| 5-May-10 | C2.3 | Yes | −1.61 | 276 | 09:49 | 13.6 | 10.7% | 07:50 | 2.54 | 1.57 |
| 149 | 10.0% | 1.07 | 11:48 | 24% | ||||||
| 11:57 | 13.3 | 14.4 | 11:45 | 2.08 | ||||||
| 5-May-10 | C8.8 | Yes | −0.50 | 62 | 13:10 | 15.1 | 8.1% | 12:15 | 3.54 | 0.31 |
| 73 | 13.4% | 0.60 | 14:11 | 70% | ||||||
| 17:23 | 13.9 | 15.0 | 17:13 | 2.14 | ||||||
| 5-May-10 | M1.2 | Yes | −1.02 | 105 | 20:03 | 16.3 | 7.9% | 17:54 | 4.17 | 0.04 |
| 160 | 17.4% | 0.45 | 21:00 | 95% | ||||||
| 05:03 | 11.9 | 12.2 | 04:52 | 2.02 | ||||||
| 8-May-10 | C9.3 | Yes | −0.98 | 191 | 07:39 | 14.1 | 2.7% | 06:09 | 3.79 | −0.09 |
| 156 | 18.4% | 0.15 | 09:09 | 88% | ||||||
| 20:15 | 11.1 | 11.4 | 20:05 | 1.98 | ||||||
| 8-May-10 | C2.4 | Yes | −0.46 | 84 | 23:39 | 12.3 | 2.9% | 21:15 | 2.57 | −0.56 |
| 204 | 10.6% | 0.28 | (129) 02:05 | 30% | ||||||
| 05:51 | 13.2 | 14.2 | 05:31 | 2.08 | ||||||
| 13-Jun-10 | M1.0 | No | 06:43 | 15.1 | 7.4% | 06:23 | 3.91 | 0.05 | ||
| 52 | 14.1% | 0.52 | 07:03 | 87% | ||||||
| 20:23 | 12.6 | 17.1 | 19:27 | 2.08 | ||||||
| 9-Jul-10 | C3.4 | Yes | −1.20 | 107 | 22:32 | 17.6 | 35% | 21:14 | 2.99 | 0.45 |
| 129 | 39% | 0.90 | (191) 02:12 | 44% | ||||||
| 19:14 | 16.0 | 18.7 | 19:03 | 2.15 | ||||||
| 16-Oct-10 | M2.9 | Yes | −1.51 | 28 | 20:14 | 23.1 | 16.5% | 19:35 | 6.97 | 0.28 |
| 60 | 44% | 0.37 | 20:43 | 224% | ||||||
| 06:59 | 13.3 | 15.7 | 05:55 | 2.05 | ||||||
| 3-Nov-10 | C3.8 | Yes | −0.35 | 28 | 08:14 | 14.0 | 18.2% | 07:05 | 2.74 | 0.55 |
| 75 | 4.9% | 3.71 | 09:23 | 34% | ||||||
| 12:29 | 15.3 | 21.0 | 12:10 | 2.09 | ||||||
| 3-Nov-10 | C4.9 | Yes | −0.61 | 29 | 15:17 | 14.6 | 37% | 13:05 | 2.81 | 3.65 |
| 168 | −4.7% | −7.9 | 17:29 | 34% | ||||||
| (309) 00:05 | 17.1 | 24.1 | 23:44 | 2.13 | ||||||
| 4-Nov-10 | M1.6 | No | (309) 02:49 | 19.8 | 41% | (309) 01:26 | 4.70 | 0.38 | ||
| 164 | 16% | 2.54 | (309) 03:42 | 121% | ||||||
| 13:33 | 16.9 | 23.9 | 13:06 | 2.13 | ||||||
| 5-Nov-10 | M1.0 | Yes | −0.90 | 202 | 16:20 | 20.1 | 42% | 14:12 | 3.98 | 1.04 |
| 167 | 19.2% | 2.17 | 17:03 | 87% | ||||||
| 16:44 | 23.3 | 31.9 | 16:02 | 5.72 | ||||||
| 6-Nov-10 | M2.5 | Yes | −1.74 | 202 | 17:56 | 27.8 | 37% | 17:07 | 7.09 | −6.40 |
| 72 | 19.3% | 1.91 | 18:45 | 24% | ||||||
| 01:50 | 17.2 | 18.7 | 01:30 | 2.17 | ||||||
| 7-Nov-10 | C5.4 | No | 02:34 | 18.4 | 8.4% | 02:01 | 3.20 | 0.41 | ||
| 44 | 6.5% | 1.28 | 02:52 | 48% | ||||||
| 08:03 | 18.9 | 19.3 | 07:19 | 2.29 | ||||||
| 15-Nov-10 | C2.3 | No | 09:25 | 20.1 | 2.2% | 08:49 | 2.75 | 0.21 | ||
| 82 | 6.6% | 0.33 | 09:52 | 20% | ||||||
| 09:02 | 8.3 | 10.0 | 08:00 | 2.01 | ||||||
| 22-Jan-11 | C2.4 | No | 09:57 | 10.0 | 19.7% | 09:25 | 2.11 | 0.13 | ||
| 55 | 19.7% | 1.00 | 10:06 | 4.9% | ||||||
| 01:13 | 8.5 | 9.6 | 00:51 | 2.01 | ||||||
| 28-Jan-11 | M1.3 | No | 02:15 | 9.4 | 13.4% | 01:28 | 2.48 | 0.41 | ||
| 62 | 11.7% | 1.15 | 02:46 | 23% | ||||||
| 01:33 | 16.0 | 16.5 | 01:23 | 2.28 | ||||||
| 9-Feb-11 | M1.9 | Yes | −0.88 | 149 | 03:53 | 18.8 | 3.5% | 02:17 | 5.12 | 0.04 |
| 140 | 17.7% | 0.19 | 05:29 | 125% | ||||||
| 07:40 | 21.2 | 26.4 | 07:25 | 2.23 | ||||||
| 24-Feb-11 | M3.5 | Yes | −1.61 | 234 | 09:02 | 30.7 | 25% | 08:15 | 8.02 | 0.33 |
| 82 | 45% | 0.55 | 09:49 | 259% | ||||||
| 10:48 | 46.2 | 52.2 | 10:35 | 3.65 | ||||||
| 8-Mar-11 | M5.3 | No | 12:03 | 50.0 | 13% | 11:18 | 9.66 | 0.50 | ||
| 75 | 8.3% | 1.56 | 12:22 | 165% | ||||||
Notes. DOY = Day Of Year. n/a = not applicable. Time values are listed as hours and minutes in UT. GOES X-ray data are the GOES XRS 0.1-0.8 nm irradiance. CME Instruments are COR2A and COR2B on STEREO and C2 on SOHO LASCO. The CME data are from CACTus catalogue (http://sidc.be/cactus). Coronal Dimming is based on SDO EVE Fe IX 17.1 nm irradiance. The Dimming Duration is time from start of dimming until the halfway recovery from the Fe IX 17.1 nm decrease. EUV Late Phase (ELP) Information is based on SDO EVE Fe XVI 33.5 nm irradiance. EVE QEUV uses the ESP 0.1-7 nm, MEGS-A 7-37 nm, and MEGS-B 37-45 nm data to determine the 0-45 nm irradiance. Main Phase Energy is the QEUV irradiance integrated from Start Time to ELP Start time. ELP Energy is the irradiance integrated from ELP Start time to ELP End Time.
As the Fe xx and X-ray emissions do not indicate any significant increase during the time of the Fe xvi second peak, this second peak may indicate additional post-flare loop reconnections, but at a lower temperature than during the flare's main phases. The additional loops are confirmed in AIA 33.5 nm band images: the separate second peak in time corresponds to post-eruption loops well above the original flaring loops for the EUV late phase flares (see example in Section 5). We note that there is a short-duration B3.4 flare near the EUV late phase peak in Figure 1, but this flare is 26 times dimmer in the X-ray than the C8.8 flare and is expected to have a small EUV increase that is much below EVE's measurement precision. While there are not significant hot corona emissions during the time of the EUV late phase (Fe xvi second peak), there are sometimes enhancements of the hot corona many minutes before the EUV late phase, namely the change in slope of the GOES X-ray during the gradual phase as seen in Figure 1 and the enhancement of the Fe xx 13.3 nm emission during the gradual phase as seen in Figure 3(b).
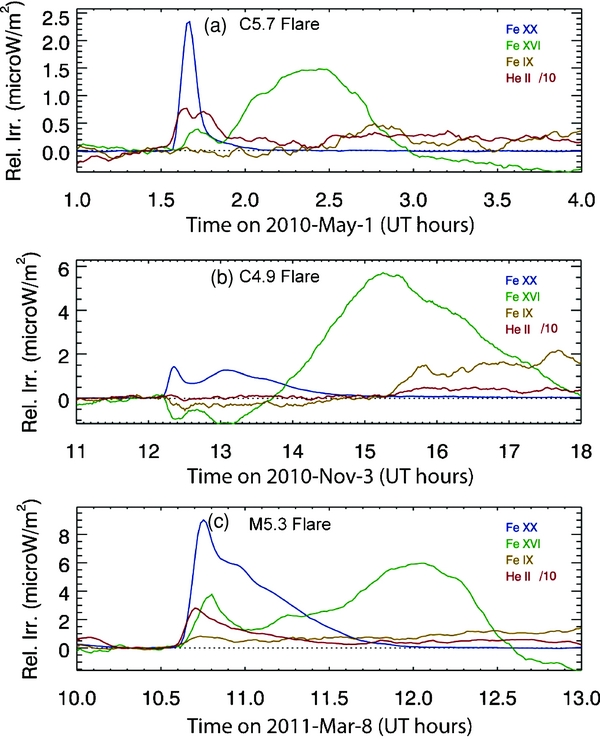
Figure 3. Example time series of three more EUV late phase flares. The "Rel. Irr." is the irradiance minus the pre-flare spectrum. The four emissions are the same as those in Figure 1. An EUV late phase flare has the second peak of the Fe xvi 33.5 nm emission several minutes to a few hours after the GOES X-ray and Fe xx/Fe xxiii 13.3 nm emission and must also have additional set of post-eruption loops above the first set of post-flare loops as verified with AIA images.
Download figure:
Standard image High-resolution imageIt is important to note that not all flares have the EUV late phase phenomenon and that the EUV late phase loops overlap in time but are spatially distinct from the initial post-flare loops whose EUV emissions peaked first during the gradual phase. Hudson (2011) and Cliver et al. (1986) point out the "extended phase" effect for HXR emissions that have secondary peaks during the SXR gradual phase. It is not clear that the HXR extended phase effect is related to the EUV late phase effect, but it is clear that some, but not all, flares have additional EUV enhancements during the gradual phase. As the EUV late phase emissions are from different loops than the SXR gradual phase loops, we expect that the late phase and the gradual phase could overlap in time as shown for the C8.8 flare in Figure 1 and is similar to the HXR extended phase overlapping with the SXR gradual phase (Hudson 2011). The EUV late phase phenomenon may be related to the post-flare giant arches studied primarily in the X-rays (e.g., Simberova et al. 1992; Svestka 1996). Simberova et al. (1992) concluded that the giant arches may be formed after an eruption by rearranging the higher and larger-scale coronal loops so that they interact and possibly reconnect, and Svestka (1996) suggested that the lower post-flare loops behave as sequential reconnections as proposed by Kopp & Pneuman (1976) but that the higher post-flare giant arches may be driven more by continuous expansion. Because their observations of giant arches do not have more complete EUV spectral coverage, it is not clear yet how EUV late phase events relate to giant arches. Our preliminary analysis of the processes for the EUV late phase is discussed more in Section 5.
Examples of EUV late phase flares are shown in Figures 1 and 3, and some flares that do not have an EUV late phase component are provided in Figure 4. For these EUV late phase flares, the cooler Fe emissions (Fe xiii down to Fe ix) also peak after the Fe xv and Fe xvi second peak, confirming a second cooling trend for these coronal loops that is much delayed since the cooling trend during the gradual phase. The cooling rate, as illustrated in Figure 5 for the C8.8 flare, is much slower for the EUV late phase loops than the cooling rate for the gradual phase loops, and this difference is expected for longer and cooler loops that have slower cooling (e.g., Cargill et al. 1995; Yoshida & Tsuneta 1995). These EVE and AIA observations emphasize that the loops are not a continuous process starting from the compact flare loops; instead the separation of the EUV emission peaks and differences in the cooling rates indicate a jump in the characteristic loop lengths, which is confirmed in AIA images for the EUV late phase flares.
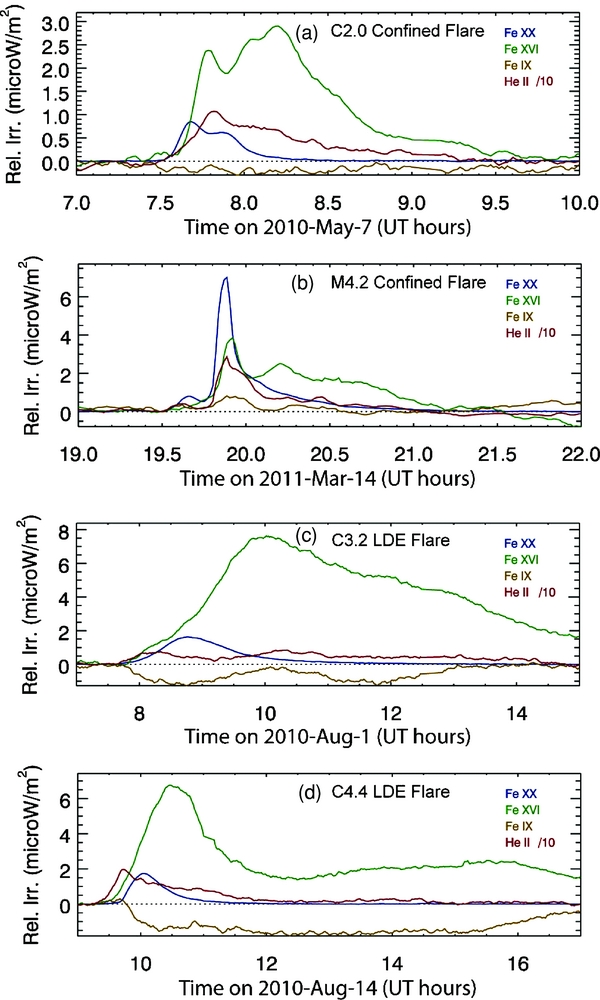
Figure 4. Example of flares that are not EUV late phase flares. The top two panels (a) and (b) are confined flares with multiple peaks of the Fe xvi 33.5 nm emission due to multiple flares as seen in the GOES X-ray and also Fe xx/Fe xxiii 13.3 nm emission. The bottom two panels (c) and (d) are examples of LDE flares. For the LDEs, the He ii 30.4 nm emission has its larger peak during the impulsive phase prior to the Fe xx peak, the Fe ix 17.1 nm emission has coronal dimming for an extended period of a few hours, and the Fe xvi 33.5 nm emission has its peak several minutes after the Fe xx peak and has elevated irradiance for a few hours.
Download figure:
Standard image High-resolution image
Figure 5. Sequence of EUV variability during the C8.8 flare on 2010 May 5. Each emission line is displayed as a horizontal bar with the color scale being relative irradiance (pre-flare subtracted). The vertical black line denotes the peak time of the GOES X-ray at 11:52 UT. The Fe xx 13.3 nm emission peaks at the same time as the GOES X-ray then followed by peaks in the Fe xviii down to Fe xv at a cooling rate of 1.3 MK per minute. The Fe xvi 33.5 nm emission has a second peak at about 13:20 UT, then the Fe xv down to Fe ix have a peak at a cooling rate of 0.1 MK per minute. Note that there are no enhancements of the hotter coronal emissions (Fe xviii, Fe xx, and GOES X-ray) during the time of the Fe xvi second peak.
Download figure:
Standard image High-resolution imageSome flares have multiple X-ray peaks during the flare's main components as that behavior is the impulsive nature of some flaring events (see Figures 4(a) and 4(b)). These flares with multiple X-ray peaks also have multiple Fe xvi 33.5 nm peaks which may appear to be like a late phase but are often not actually true late phase flares. In particular, AIA images need to be evaluated to verify if it was an eruptive flare and had two distinct sets of post-eruptive loop reconnections.
As illustrated in Figure 6, the EUV late phase variations also appear to be obviously distinct from any non-flaring AR evolution, which has different spectral signatures than the late phase variations and tends to be even slower than the EUV late phase. The AR evolution indicates more uniform variation over all wavelengths, but the late phase variation indicates that the warm coronal Fe xv and Fe xvi emissions dominate. Later in Section 5, we will discuss how this late phase is directly related to and a consequence of the continued evolution of the post-flare loop reconnection from higher and longer coronal loops.

Figure 6. Spectral comparison of late phase variation to AR evolution. The EUV variations are shown for (a) a day with many flares on 2010/125, (b) a day with just AR evolution on 2010/133, and (c) comparison of spectral variability. In panel (c), the late phase variation from the C8.8 flare on 2010 May 5 (green line) is compared to the AR evolution on 2010 May 13 that is measured as a red line but divided by 5.6 as a black line for more direct comparison to late phase variation. The AR evolution indicates more uniform variation over all wavelengths, but the late phase variation indicates that the warm coronal Fe xv and Fe xvi emissions dominate.
Download figure:
Standard image High-resolution imageIt is important to note that the EUV late phase is distinct from a long-duration flare. The physics of plasma cooling in higher loops appear to be important for both the EUV late phase and LDE, but the EUV late phase has two peaks of warm coronal emissions while the LDE has only a single gradual phase peak. More specifically, the Fe xvi 33.5 nm emission typically has its first peak delayed after the X-ray peak, and this is consistently seen for all the flares shown in Figures 3 and 4 and for most other flares too. The delay time for this first peak is a few minutes for non-LDE flares but is much later for the LDE flares shown in Figures 4(c) and (d). The EUV late phase is associated with a second peak of the Fe xvi emission that is even more delayed from the X-ray peak than its first peak. The EUV late phase peak indicates a separate energy release and heating event, likely because a topologically distinct set of loops is involved; this energy release occurs at lower temperatures (<5 MK) than the original flare (>16 MK) as there is little, if any, enhancement seen in the GOES X-ray data during the late phase. The LDE flares usually only have a single peak of the Fe xvi 33.5 nm emission, albeit much delayed from the X-ray peak. One could perhaps argue that the EUV late phase is an LDE but manifested differently than the typical two-ribbon flare which only has a single Fe xvi peak.
The frequency and importance of the EUV late phase to the spectral irradiance was not fully recognized until the first flare observations by SDO EVE. While there are several results for the EUV irradiance during the flare's main phase (e.g., Woods et al. 2006), previous solar EUV irradiance instruments did not have the continuous time coverage, time cadence, spectral resolution, or spectral range to adequately observe this late phase phenomenon. There are likely indications of the EUV late phase in solar EUV images (e.g., Aschwanden et al. 2009b). The preliminary studies given in Section 5 indicate that the EUV late phase peaks are associated with coronal loops higher and longer than the original flaring region, so we consider the late phase to be part of the original flare event.
4. EUV LATE PHASE GEOEFFECTIVENESS
The irradiance integrated shortward of 45 nm is an important indicator for the solar EUV irradiance input to Earth's ionosphere and thermosphere. Strickland et al. (1995) defined this 0–45 nm EUV band as the QEUV and is part of their analysis of Earth's far ultraviolet (FUV) airglow. Then further integration over time provides the total flare energy in the QEUV band. This total energy of the EUV late phase peak exceeds the main flare peak energy for 8% of the EUV late phase flares due to the warm coronal emissions having a large, broad second peak. The amount of the QEUV energy released during the late phase relative to the initial X-ray flare energy is typically about a ratio of 0.4 and is as large as a factor of 3.7 for the C4.9 flare on 2010 November 3 (see Figure 3(b)). In other words, there is typically 40% more energy from this type of flare when including its EUV late phase contribution. For example, the C5.7 flare shown in Figure 7, the QEUV has a 50% increase at the main flare peak and a 2.1% increase at its EUV late phase peak 62 minutes later, both of these increases are relative to the pre-flare value. Furthermore, the relative QEUV integrated over the main phase and EUV late phase has energy flux of 0.52 J m−2 and 0.26 J m−2, respectively. Although the late phase QEUV peak is much smaller than the main phase peak, the EUV late phase duration is much longer and consequently the late phase energy is similar to the main phase energy change of the QEUV.
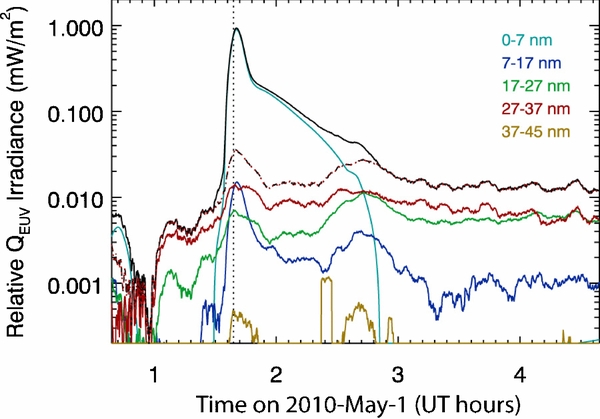
Figure 7. Time series of the EUV irradiance during the C5.7 flare on 2010 May 1. This plot shows the decomposition of the QEUV (0–45 nm) irradiance (black line) into broadbands. The relative irradiance is the change from the daily (non-flaring) minimum irradiance (minimum QEUV is 1.91 mW m−2). The dotted line is the GOES X-ray peak at 01:39 UT. The 0–7 nm and 7–17 nm bands dominate the QEUV during the main peak, and the 27–37 nm band dominates during non-flaring times. The late phase contributions are primarily from the 17–27 nm and 27–37 nm bands. The dashed line is the EUV part of the QEUV from 7 nm to 45 nm.
Download figure:
Standard image High-resolution imageBecause the GOES X-ray measurements only capture the flare's main components well, current empirical flare-irradiance models, such as Flare Irradiance Spectral Model (FISM; Chamberlin et al. 2008) and Solar Irradiance Platform (SIP; Tobiska et al. 2000) that use the emission measured by the X-ray as a flare proxy, are improperly estimating the total flare energy. Obviously, new flare models need to be developed with the EVE data for the space weather community.
With the new EVE data set, we can address which spectral features are contributing the most to the QEUV band. It is important to note that during non-flaring times the QEUV is dominated by the very bright He ii 30.4 nm emission and the many bright Fe emissions in the 17–21 nm range (see Figure 2(a)). Figure 7 shows the QEUV near the time of the C5.7 flare on 2010 May 1 and decomposition of the QEUV into broadbands. The 0–7 nm band is from the ESP zeroth-order channel. The 7–17 nm, 17–27 nm, and 27–37 nm bands are the irradiances integrated over wavelength using MEGS-A spectra. The 37–45 nm band is the integrated irradiance using MEGS-B spectra. To highlight the flare (short-term) variations, the QEUV irradiance variations in Figure 7 are relative to the QEUV pre-flare minimum. The most obvious contribution to the QEUV variation is the 0–7 nm band during the flare's main peak, and next most important main flare contribution is the 7–17 nm band. The delayed second peak seen so clearly in the warm coronal emissions is not very apparent in the QEUV time series. However, the QEUV after the main phase is elevated relative to the pre-flare level, and the 27–37 nm and 17–27 nm bands are most responsible for this elevated QEUV level.
The impact of the solar EUV irradiance on Earth's atmosphere is highly dependent on the spectral variations. For example, the solar 0–7 nm irradiance is deposited lower in the ionosphere and thus the main flare event is most effective in the lower ionosphere. However, the solar 17–37 nm is absorbed higher in the ionosphere and thermosphere; thus the long duration of the EUV late phase will have a larger impact on the upper layers of the ionosphere and thermosphere and for over a longer period than the short burst of EUV energy from the main flare event.
5. EUV LATE PHASE PROCESSES
Detailed analysis of solar images, primarily of SDO's AIA solar EUV images, provides insight into the evolution of the flare events and possible causes of the delayed second peaks that we see in the solar EUV irradiance time series. One enlightening technique is to view difference images—the difference of one solar image from an image taken a few minutes before. Another useful technique is examining the time series of the signal from small regions near the flare event. While we have examined dozens of flares for this paper, we concentrate on the C8.8 flare on 2010 May 5 as a single characteristic example of what is seen similarly for other late phase flares (Hock et al. 2011). We provide some AIA images and additional time series plots for this flare event in Figures 8 and 9 and an animation of this flare is available in the online version of the journal. Figure 8 highlights four times during the flare evolution: pre-flare, main flare peak, EUV late phase peak, and post-EUV late phase. The top panel in Figure 9 highlights the flare evolution of the main flare region and upper loop region that is responsible for the late phase peak. These two regions, shown as white boxes in the bottom right image of Figure 8, account for more than 85% of the flare variations. The bottom panel of Figure 9 shows the EVE irradiance time series, including the EVE spectra convolved to the AIA 33.5 nm band (AIA-335). Note that the AIA-335 variability is scaled down in Figure 9(b), as expected from the EVE data being from the full disk while the AIA signal is from just the 500 × 500 pixels AR. This effect could explain some of the differences between the EVE-derived AIA-335 band and measured AIA-335 signal, and perhaps the broadband nature of the AIA-335 also contributes to these differences.

Figure 8. Time evolution of the AIA Fe xvi 33.5 nm image for AR 11069 during the C8.8 flare on 2010 May 5. The times given are in UT. The time series in the top panel is the variability of the AIA signal for this AR using the full 500 × 500 pixels in the images. The right images are the intensity images using a logarithm color scale for the intensity. The left images are the difference images by taking the difference of one image to a prior image with a time offset of Δt as shown in the time series plot. The key features of how the flare evolved are indicated on the difference images. The bottom right image highlights as white boxes the main flare and upper loops regions used for Figure 9 time series.(An animation of this figure is available in the online journal.)
Download figure:
Standard image High-resolution image
Figure 9. Time series of the C8.8 flare on 2010 May 5. Panel (a) shows the variability of the AIA 33.5 nm band (AIA-335) signal for the full 500 × 500 pixels image shown in Figure 8 (black), main flare region (red), and upper loops region (green). These two smaller regions are shown as white boxes in the bottom right image in Figure 8. Panel (b) shows the irradiance variability that includes the EVE Fe xvi 33.5 nm line (green), EVE spectra convolved to AIA-335 (red), and AIA-335 signal scaled down (black). Variability is defined as the relative change from the pre-flare (PF) level (Variability = (Signal–PF)/PF).
Download figure:
Standard image High-resolution image
This C8.8 flare was from AR 11069, which was located at 40° W and 41° N on the solar disk. AR 11069 is a complex multi-polar AR and is the site for six EUV late phase flares. The central, lower part of the region clearly erupts, as unmistakably seen in the AIA movies. Upward motions are visible as early as 11:16 UTC, but rapid acceleration commences at about 11:49 UTC. It is at this time that a classic flare loop arcade first appears. The arcade has a bright cusp-shaped top and slowly grows as more and more reconnected magnetic flux accumulates. The magnetic reconnection that powers the main peak emission is an intimate part of the eruption process. It begins early in the event, when the erupting structure is still well within the AIA field of view. While the onset of the eruption may be due to what is known as break-out reconnection (Antiochos et al. 1999), it is the flare reconnection that produces the rapid acceleration (MacNeice et al. 2004).
We propose that the EUV late phase peak may have a similar physical origin, but that the location and rate of reconnection are very different. This later reconnection involves magnetic fields that arch high over the AR in the pre-eruption state, in contrast to the low-lying core fields that are involved in the main phase reconnection. The location of this AR on the solar disk permitted excellent viewing to verify that these upper loops are well displaced from the lower loops. The eruption stretches open these initially closed magnetic fields to create a vertical current sheet. Reconnection at high altitudes in the sheet reforms the closed fields by producing new loops that accumulate, one on top of the other. The AR is essentially rebuilt from the bottom up, though with less shear and less stress than the original pre-eruption state. The loops cool as they accumulate and therefore hot loops are observed to overlie cooler loops in the AIA images. Furthermore, emissions near 3 MK, such as from Fe xv and Fe xvi, tend to be more diffuse because the rate of cooling is relatively slow at these temperatures and many overlapping loops are visible at the same time. Distinct loops are more evident in emissions near 1 MK, such as from Fe ix, because the cooling is faster and fewer loops are present at the same time (Patsourakos et al. 2002; Guarrasi et al. 2010).
Long-duration emission following flares has been previously observed (McKenzie & Hudson 1999; Gallagher et al. 2002). It is well known that many large eruptive flares, primarily from two-ribbon flares, have a GOES X-ray signal that can persist for several hours. What is new is the realization that many additional flares, namely the EUV late phase flares, have long-duration emission that does not appear to reach the 10 MK or higher temperatures where the GOES X-ray Sensor (XRS) is sensitive. As these new measurements suggest, it seems reasonable that the EUV late phase flares have weaker post-flare loops reconnecting than the eruptive two-ribbon flares.
An interesting question is how often and why there is a delay before the secondary reconnection begins. Long-duration GOES XRS events, such as the August 1 flare shown in Figure 4(c), do not usually have such a delay in X-rays. One option that we considered was if the post-flare loop reconnection is continuous without a break but that the Fe xvi irradiance is exhibiting coronal dimming behavior. Coronal dimming as associated with an eruptive flare (CME) is very likely the reason for the decrease seen in the Fe ix irradiance after the flare onset (e.g., Rust 1983; McIntosh et al. 2007), but the Fe xvi decrease is much later, starting many minutes after the impulsive phase completed. Alternatively, the long delay for the EUV late phase peak could be due to additional post-flare loop reconnections but less energetic than those during the gradual phase because X-ray enhancements are not observed. As confirmed with AIA images, different magnetic flux systems are indeed involved and thus explain the delay between the main phase and EUV late phase reconnections, as well as possibly explain the weaker nature of the late phase reconnection. Complex ARs, such as AR 11069, contain several topologically distinct flux systems. The fields that reconnect during the flare's main phase begin as one or more relatively compact, high field strength structures in the core of the AR. We know this because the footpoints of the flare arcade are not widely separated. The fields that reconnect during the EUV late phase are weaker and larger-scale fields that span the entire AR. The Fe ix and Fe xvi loops produced during the EUV late phase are high arching and have footpoints located near the AR perimeter. A key difference in the two different magnetic flux systems is their loop lengths and thus can explain both the timing and intensity differences of the two phases. Based on the several flares observed during the first year of the SDO mission, a true EUV late phase (as opposed to just noting two peaks in the Fe xvi 33.5 nm irradiance flare time series) is required to have an eruption from a complex multi-polar AR and to observe two spatially distinct sets of post-flare loop systems. Our provisional analysis of HMI magnetograms and AIA movies seems to bear this out. A more comprehensive report of the many flares during the SDO mission is provided by Hock et al. (2011).
6. CONCLUSION
Prior to the SDO mission, the flare irradiance models have been using the GOES X-ray signal as a proxy for the gradual phase and the derivative of the X-ray signal as a proxy for the impulsive phase emissions. It is clear now with the SDO EVE and AIA measurements that at least two additional flare components—(1) coronal dimming for cool coronal emissions and (2) an EUV late phase for warm coronal emissions—are required for modeling the EUV irradiance. While coronal dimming and long-duration events like post-flare giant arches have been known for some time, their impact on EUV irradiance is now being clarified with the new SDO observations. The new EVE results are also very important for many space weather applications as deposition of the solar EUV irradiance into Earth's atmosphere depends on the spectral variability, that is, which wavelengths are varying, and on the timing that determines the local (regional) effects on Earth. For example, the ionospheric F layer is expected to have an additional increase one to five hours after the GOES X-ray peaks for EUV late phase flares. These late phase flares are also significant because they can enhance the total EUV irradiance (QEUV) flare variation by a factor of 40% or more when the EUV late phase contribution is included. Obviously, the new EUV irradiance observations from SDO EVE have huge potentials for expanding our understanding of how different EUV emissions vary during flares and how these variations can cause changes in Earth's ionosphere and thermosphere over many different timescales. While we have made some progress in understanding the EUV late phase solar process based on several flares, the wealth of new data from SDO and other solar observatories over the next several years is expected to lead to even more insightful knowledge of the solar processes throughout the flare time series.
The SDO mission and this research are supported by NASA. The authors thank Vanessa George for her assistance with this manuscript.
Footnotes
- 10
See the CME lists at http://sidc.oma.be/cactus/.