


 t, 17 Bât B5c, 4000 Liège, Belgium
ABSTRACT
We report on high contrast near-infrared (∼2.2 μm) observations of Vega obtained with the Palomar Fiber Nuller, a dual sub-aperture rotating coronagraph installed at the Palomar Hale telescope. The data show consistent astrophysical null depth measurements at the ≃ 10−3 level or below for three different baseline orientations spanning 60 deg in azimuth, with individual 1σ uncertainties ⩽7 × 10⁻⁴. These high cancellation and accuracy levels translate into a dynamic range greater than 1000:1 inside the diffraction limit of the 5 m telescope beam. Such high contrast performance is unprecedented in the near-infrared and provides improved constraints on Vega's immediate (≃20 to 250 mas, or ≃0.15 to 2 AU) environment. In particular, our measurements rule out any potential companion in the [0.25–1 AU] region contributing more than 1% of the overall near-infrared stellar flux, with limits as low as 0.2% near 0.6 AU. These are the best upper limits established so far by direct detection for a companion to Vega in this inner region. We also conclude that any dust population contributing a significant (⩾1%) near-infrared thermal excess can arise only within 0.2 AU of the star, and that it must consist of much smaller grains than in the solar zodiacal cloud. Dust emission from farther than ≃2 AU is also not ruled out by our observations, but would have to originate in strong scattering, pointing again to very small grains.
Export citation and abstract BibTeX RIS
1. INTRODUCTION
Planets are believed to form out of the material in circumstellar disks known to exist around young stars. The pre-planetary disks are generally quite bright, and have been very well studied at high angular resolution by interferometry in recent years (e.g., Monnier et al. 2005; Millan-Gabet et al. 2006; Tannirkulam et al. 2008). As planets are formed, the opacity of the primordial disk rapidly decreases, and a transition is observed to the regime of debris disks, with inner warmer regions commonly referred to as "exozodiacal clouds." Because zodiacal dust grain lifetimes are much shorter than stellar lifetimes, it is believed that zodiacal dust must be regenerated (Backman & Paresce 1993) to be present around main-sequence stars. The inner (0.1–10 AU) distribution of exozodiacal dust in debris disks thus reflects dynamical interactions at the heart of planet formation, and so are of great scientific interest. More generally, the determination of the exozodiacal emission level and its central (<10 AU) spatial distribution around nearby main-sequence stars has long been identified (e.g., Beichman & Velusamy 1997; Mennesson & Mariotti 1997) as crucial information both for planetary formation and planet–disk interaction models, and for the design of direct exoplanet imaging space missions.
However, exozodiacal disks are generally much fainter and difficult to observe than proto-planetary disks. Debris disks observed to date around nearby stars (e.g., Holland et al. 1998; Siegler et al. 2007) are located predominantly far from their host stars (tens to hundreds of AU), and so are more analogous to our solar system's dusty Kuiper Belt, located beyond our planetary belt, than to the ∼ AU-scale zodiacal disk inside our solar system's asteroid belt. This observational bias results from several factors: (1) small potential exozodiacal disk sizes, (2) faintness relative to the host stars, and (3) the use of long (far-infrared) observing wavelengths more sensitive to very cool dust. Detection of faint exozodiacal emission very near bright stars thus requires high angular resolution, and either a means of suppressing starlight or a high dynamic range. Near and mid-infrared high-resolution high-contrast interferometric instruments such as the Fiber Linked Unit for Optical Recombination (FLUOR) on the CHARA array (Absil et al. 2006), the Bracewell Infrared Nulling Camera (BLINC) at the MMT (Liu et al. 2004), and the Keck Interferometer Nuller (KIN; Colavita et al. 2009) have all tackled this issue of exozodiacal light characterization. At both wavelength ranges, similar contrast levels were obtained in the inner 10 AU region around nearby main-sequence stars: typically 0.2% at 1σ. Quite surprisingly, this common instrumental performance has so far yielded many more excess detections in the near-infrared than in the mid-infrared. Indeed, most mid-infrared results so far are upper limits: out of 23 nearby main-sequence stars with no previously known far-infrared excess surveyed by one of the two main KIN key science programs, only one of them shows clear mid-infrared excess at the current detection levels (Millan-Gabet et al. 2011). Conversely, in spite of the higher contrast expected, a larger fraction (≃25%; O. Absil et al. 2011, in preparation) of main-sequence stars have shown significant (1%) near-infrared excesses in their inner 10 AU (Absil et al. 2006, 2008, 2009; Akeson et al. 2009; Di Folco et al. 2007). More detections of this kind are currently being unearthed by an ongoing FLUOR survey. Interestingly, these same stars were surveyed in the mid-infrared with BLINC and KIN, and no excess was detected so far at current thresholds, except in the case of β Leo (Stock et al. 2010). These results have been interpreted as implying the presence of hot (⩾ 500K) dust populations around a significant fraction of A to G main-sequence stars—although the survey of a larger sample is required to derive robust statistics. Importantly, these putative bright exozodiacal disks appear much hotter than the zodiacal cloud, making the near-infrared an optimal region for characterization of such hot dust. This also suggests that debris disk characteristics may strongly differ from our own zodiacal cloud, and that high contrast, near-infrared interferometric observations might be a very powerful tool for conducting a statistical survey of exozodiacal disks.
In this context, a near-infrared high dynamic range (10−4 to 10−3) interferometric capability could provide an ideal solution for conducting deep surveys of exozodi clouds around nearby stars. It was one of the major drivers for the development of the fiber nulling approach (Haguenauer & Serabyn 2006; Serabyn & Mennesson 2006a; Mennesson et al. 2006) and the deployment of the Palomar Fiber Nuller (PFN) at the  Hale telescope (Martin et al. 2008; Mennesson et al. 2010; Serabyn et al. 2010). High contrast observations with this technique promise to further our understanding of the hot dust phenomenon, whose actual origin remains unclear. Indeed, this excess could theoretically arise from thermal emission from hot dust (extended or restricted to annular inner regions), more point-like structures such as clumps (perhaps resonant clumps), or low mass companions.
Since larger-scale debris disks detected in the FIR show statistical dimming with stellar age (e.g., Siegler et al. 2007), the search for smaller-scale exozodiacal emission is likely best begun around fairly young, nearby stars with other evidence of dust. A prime candidate is therefore Vega, a nearby (7.8 pc) bright (0 mag) A0V star, with one of the first detections of excess FIR emission from a large debris disk (Aumann et al. 1985). Many of Vega's properties are well characterized, including its nearly pole-on orientation, its pole-to-equator temperature variation and limb darkening (Aufdenberg et al. 2006), and its nearly face-on large-scale debris disk (Wilner et al. 2002; Su et al. 2005). Moreover, some data regarding potential exozodiacal dust around Vega also exist: MIR limits on excess emission of ≃2% derived by MMT/BLINC (Liu et al. 2004, 2009) and by KI nulling (unpublished results), and a small near-infrared (NIR) short-baseline visibility deficit (Absil et al. 2006) suggesting the presence of some very hot dust. Vega is thus perhaps an ideal first candidate for observations with the PFN.
2. PFN VEGA OBSERVATIONS AND RESULTS
Full descriptions of the PFN coronagraph hardware, observing procedure, and data reduction strategies are given in recent papers (Martin et al. 2008; Mennesson et al. 2010; Serabyn et al. 2010; Hanot et al. 2011). Vega was observed with the PFN in 2009 July with a constant 3.20 m baseline and three different azimuthal orientations spanning a range of 60 deg. At each orientation, a four minute long sequence of null depth measurements was recorded. A statistical analysis of the measured fluctuating null depth distribution (Figures 1 and 2) is used to recover the underlying astrophysical null depth Na, which is directly related to the source visibility.3 More precisely, the astrophysical null depth is derived by minimizing a goodness of fit χ2 test comparing the observed null distribution to a model distribution. Complete details about this "Null Self Calibration" method are given in Hanot et al. (2011). The error bar (1σ confidence interval) on Na is first obtained by variation around its optimal value, using regular χ2 statistics. However, this error bar estimation is only valid if the noise is dominated by a zero mean Gaussian process. We then also conducted a bootstrapping analysis (independent of the actual noise properties), resampling and replacing the observed null values, and generating many (500) fake null sequences derived from the observed data. Analyzing the corresponding sequences yields astrophysical null 1σ (68.3% confidence interval) uncertainties very similar to those derived using the χ2 approach. The final error bar quoted on Na is the largest of the uncertainties derived by the χ2 and by the bootstrapping methods.
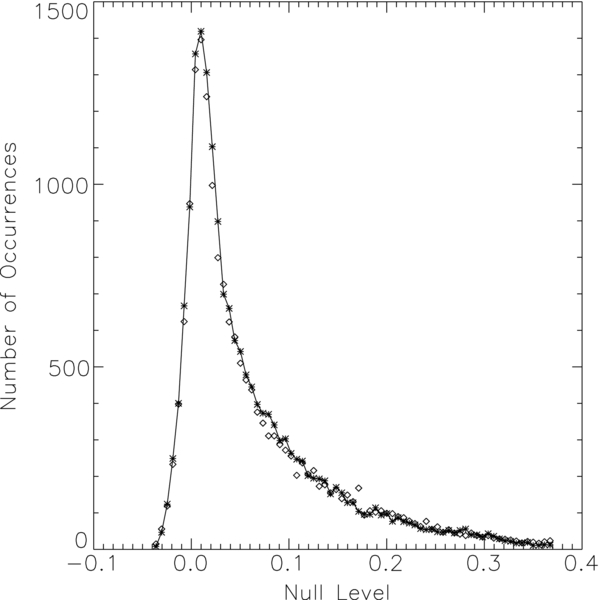
Figure 1. Distribution of null values recorded on Vega with the Palomar Fiber Nuller for a baseline azimuth of 117°. Data points represented by asterisks show the observed number of occurrences in a given null interval, while diamonds indicate the values derived for the best-fit model distribution. The underlying astrophysical null depth—close to the distribution peak—is found to be Na = 0.0012 ± 0.0005 (1σ) for the best-fit model (reduced χ2 of 1.15).
Download figure:
Standard image High-resolution image
Figure 2. Different models of the null depth distribution measured on Vega (same data set as in Figure 1, but concentrating on the peak of the distribution). Asterisks show the observed number of occurrences in a given null interval, while diamonds indicate the values derived for a given model distribution. The underlying astrophysical null depth—close to the distribution peak—is found to be Na = 0.0012 ± 0.0005 (1σ) for the best-fit model (reduced χ2 of 1.15) represented in the center top panel. The top left and top right panels show the fits obtained when fixing the astrophysical null depth, respectively, −5σ and +5σ away from the best-fit value. The respective reduced χ2 of these models are 2.57 and 3.09. The lower panels show residuals between the modeled and observed distributions for each of the three assumed astrophysical null values, illustrating the sensitivity of the method to null offsets as low as 0.0025.
Download figure:
Standard image High-resolution imageTable 1 summarizes Vega's astrophysical null depths derived as a function of baseline azimuth angle. All measured nulls have 1σ error bars smaller than 0.001. The orientation averaged null depth estimate, taking measurement scattering and individual uncertainties into account, is Na= 0.0008 ± 0.0004 (weighted mean and weighted standard deviation). In comparison, adopting Vega's latest gravity darkened photospheric model (Aufdenberg et al. 2006), the expected null depth is 0.0004 at 2.2 μm at the PFN 3.20 m baseline. (In fact, Vega's photosphere is hardly resolved at this spatial resolution, and a cruder uniform disk model provides the same value at the 10−5 level). The residual null obtained after subtracting the 0.0004 diameter limited null depth characterizes a potential "excess leakage" above the photosphere. Its orientation average is then 0.0004 ± 0.0004, showing that the PFN observations do not detect any emission above that predicted for the photosphere that is statistically significant.
Table 1. Summary of Vega PFN Observations Recorded on 2009 July 9
| Az (°) | Na | σ | Residual Null | Excess 3σ Upper Limit |
|---|---|---|---|---|
| 87 | −1 × 10⁻⁴ | 7 × 10⁻⁴ | −5 × 10⁻⁴ | 1.6 × 10⁻³ |
| 117 | 12 × 10−4 | 5 × 10⁻⁴ | 8 × 10⁻⁴ | 2.3 × 10⁻³ |
| 147 | 10 × 10−4 | 6 × 10⁻⁴ | 6 × 10⁻⁴ | 2.4 × 10⁻³ |
Notes. Az is the baseline azimuth measured in degrees east of north. Na is the measured astrophysical null. The residual null (or "excess leakage") is computed by subtracting the null depth expected from Vega's photosphere, which is 4.0 × 10⁻⁴ at the PFN 3.20 m baseline and 2.16 μm effective wavelength.
Download table as: ASCIITypeset image
For each baseline orientation, Table 1 indicates the residual null measured on Vega (i.e., the excess leakage obtained after subtraction of the photospheric null) and its 3σ upper limit. In order to convert the measured excess leakage to a true astrophysical excess, one must correct for the nuller sky transmission pattern, which is limited to about 300 mas FWHM (Mennesson et al. 2010). The maximum (3σ) relative flux compatible with the data is then derived at each of the three baseline orientations. At any given location in Vega's immediate environment probed by the instrument, only the lowest of these three limits is retained. This yields the final "upper flux limit map" (Figure 3 left), i.e., the maximum (relative) K band flux of a companion as a function of its location. At the very center of the field, within 0.05 AU of Vega, the contribution of any off-axis source would be nulled out, and so no useful flux constraint can be derived. Similarly, the PFN data do not reflect emission from sources located farther than ≃3 AU, i.e., beyond the single-mode fiber field of view. Our data are most sensitive to the central [0.25–1 AU] region where we can rule out the presence of any companion contributing more than 1% of the overall K-band flux. This corresponds to the best point source upper limits derived so far by direct detection in this range of separations around Vega. At a given distance from Vega, the derived companion flux limit is a function of azimuth, reflecting the observed slight azimuthal variations as well as the incomplete (60° span) baseline rotation. Figure 3 (upper right) shows as an example the upper limits derived at 0.6 AU as a function of azimuth angle, with values ranging from 0.2% to 0.6%. The residual "spikes" visible at azimuths of ≃30 and ≃210 deg are expected, as these angles are 90 deg away from the mean baseline orientation (117 deg).
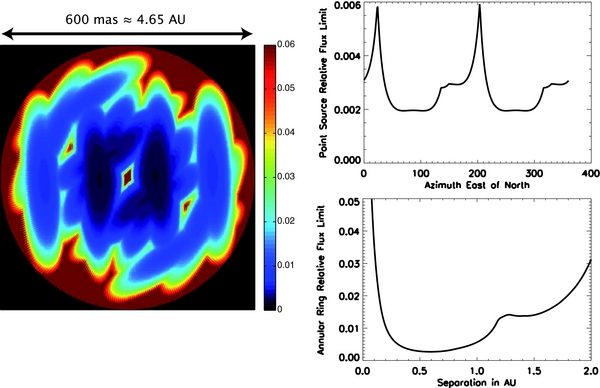
Figure 3. Vega circumstellar emission upper limits derived from PFN data recorded at three baseline orientations. Left: map of the maximum (3σ) point-source levels (relative to Vega) consistent with the PFN data. North is up, east is to the left. Field-of-view radius is 300 mas around Vega (≃2.3 AU). As expected, constraints on a putative companion get looser at the edge of the fiber field of view, and at the center of the field, where destructive interference occurs for all baseline orientations. Right, top: upper limit at 0.6 AU (=47 mas) as a function of source position angle. Right, bottom: azimuthal average of left map. This corresponds to the 3σ upper flux limit for a geometrically thin ring around Vega. It is consistently below 0.6% between 0.2 AU (≃25 mas) and 1.0 AU (≃130 mas), and as low as 0.3% around 0.6 AU.
Download figure:
Standard image High-resolution imagePotential stellar mass companions have already largely been ruled out within 10 AU of Vega by astrometric and radial velocity limits (Absil et al. 2006). Conversely, diffuse emission by low mass debris disks cannot be detected by those gravity based techniques, and the PFN observations bring new constraints on the flux level and physical characteristics of hot dust in the inner 2 AU around Vega. As there is strong evidence (Peterson et al. 1999; Aufdenberg et al. 2006) that Vega is viewed very nearly pole-on (inclination of ∼5°), here we only consider circularly symmetric disk structures. As a convenient case to study, we further concentrate hereafter on geometrically thin (0.01 AU) circular rings located at various radii. As can be seen in Figure 3 (bottom right), the relative flux of a circular dust ring is best constrained by the PFN data between 0.2 AU (≃25 mas) and 1.1 AU (≃140 mas). In particular, we find that the existence of a geometrically thin ring contributing more than 0.6% of Vega's K band flux is ruled out (at the 3σ level) anywhere between 0.25 and 1 AU. Similarly, over the same region, our results imply that a uniform source of emission cannot contribute more than 0.4% of excess in the near-infrared. Clearly, if a hot debris disk is responsible for a substantial amount (⩾1%) of NIR extra-emission, the PFN observations indicate that it must either arise from within ≃0.2 AU, i.e., in the close vicinity of the dust sublimation region, and/or from colder (⩽800 K) regions located farther away than ≃1 to 2 AU. Further observational data are required to assess the viability of these two dust population scenarios and derive more physical information on the nature of a potential near-infrared excess around Vega. This is the objective of the next section.
3. COMPARISON TO EXISTING HIGH CONTRAST HIGH RESOLUTION DATA
3.1. High Angular Resolution Direct Imaging Data
Over the last few years, there has been numerous efforts to directly characterize Vega's close environment, searching in particular for faint nearby companions. AO assisted high dynamic range infrared observations have been successively carried out at Keck (Macintosh et al. 2003), Palomar (Metchev et al. 2003), Gemini North (Marois et al. 2006), Subaru (Itoh et al. 2006), and the MMT (Hinz et al. 2006), all concentrating outside of 2'' from Vega. The deepest images inside of that region were obtained with the AEOS 3.63 m telescope H band coronagraphic system (Hinkley et al. 2007). Even in that case, no information was retrieved inside the occulting mask 220 mas radius, and no companion brighter than mH = 7 (5σ limit) was detected outside of 300 mas (≃2.3 AU). Interestingly, this resolution limit roughly corresponds to the field of view of the PFN, illustrating that the range of separations explored by the PFN is in the realm of interferometers rather than current coronagraphs.
3.2. NIR and MIR Interferometric Data
Here we review the existing interferometric data about the potential magnitude of an infrared excess within a few AU of Vega. Very few instruments have the required combination of spatial resolution and contrast to provide such information.
Very accurate near-infrared observations of Vega have been obtained in K band with the FLUOR instrument of the CHARA long baseline interferometric array (Absil et al. 2006; Aufdenberg et al. 2006). In particular, these measurements show a "visibility deficit" at short baselines, which Absil et al. attribute to the probable presence of a hot debris disk, contributing about 1.3% of Vega's flux within the FLUOR field of view (≃7.8 AU). In the mid-infrared (at 10.6 μm), single telescope nulling observations have been conducted on the MMT using the BLINC instrument (Liu et al. 2004, 2009), concluding that there is no resolved emission from the circumstellar environment (at separations greater than 0.8 AU) above 2.1% (3σ limit) of the level of the stellar photospheric emission. Additionally, the authors find that the null does not vary significantly with observations at different rotations of the interferometer baseline (over a range of about 90 deg), indicating that there is no evidence of an inclined disk-like structure. Broadband (8–13 μm) mid-infrared measurements at higher spatial resolution were recently obtained by long baseline—separated aperture—nulling at the Keck Interferometer. In particular, measurements obtained as part of the instrument shared risk commissioning (2007 June, unpublished data) detected no significant excess either, with the excess leakage estimated to be 0.33% ± 0.25% at an effective wavelength of 9 μm.
Figure 4 summarizes the excess leakages measured with the PFN and CHARA instruments in the near-infrared, and with the MMT and the Keck Interferometer Nuller (KIN) in the mid-infrared. The KIN results cover a small range in azimuth due to the fixed KI baseline, while the CHARA, PFN, and MMT results cover larger azimuth ranges: respectively 40, 60, and 95 deg. To get a consistent view of the results provided by the different instruments, we converted the CHARA visibility deficit observed with their 34 m baseline into an equivalent excess leakage of 0.55% ± 0.1%. From the CHARA, MMT, and KIN measured excess leakages, and using the simple ring model suggested above for the PFN data, we derive constraints on the relative flux of a putative geometrically and optically thin dust ring around Vega (Figure 5). As in the case of the PFN observations (Section 3), this is done by folding in the sky transmission pattern for each of these three facilities. In the case of KIN, we use the transmission pattern computed at the time of the observations, including the effects of the short and long baseline fringes, together with the field of view limitations introduced by the camera optics (focal plane pinhole and finite spectral dispersion). Full details can be found in Colavita et al. (2009), as well as in Millan-Gabet et al. (2011) and E. Serabyn et al. (2011, in preparation). For the MMT, we computed the expected sky transmission pattern from a 10.6 μm nuller formed of two 2.5 m sub-apertures separated by 4 m. As in the case of the PFN, no excess was detected in the mid-infrared by the KIN and MMT instruments, and the corresponding curves in Figure 5 represent the ring flux 3σ upper limits as a function of distance to the star. Also clearly apparent is the nice complementarity of the KIN and MMT mid-infrared data in terms of spatial scales covered.
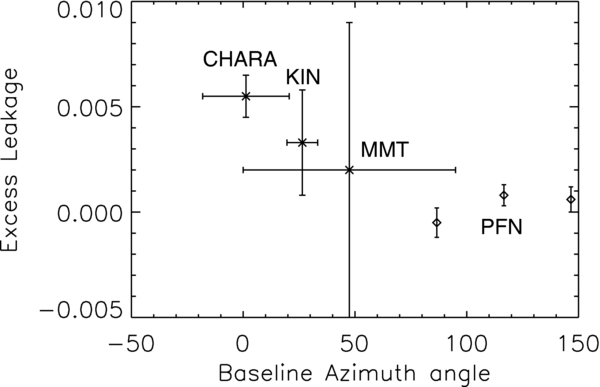
Figure 4. Excess leakage measured on Vega by various instruments at different baseline orientations (azimuth east of north in degrees). In all cases, the photospheric null has been subtracted and an excess leakage traces possible resolved sources of extra emission. CHARA data use a 34 m baseline at K band and show a >5σ excess. In comparison, significant excess is neither detected by the Palomar Fiber Nuller (PFN, baseline = 3.2 m, also at K band) nor by the Keck Interferometer Nuller (KIN, baseline = 85 m, λ ≃ 9 μm), nor by the MMT (baseline = 4 m, λ ≃ 10.6 μm).
Download figure:
Standard image High-resolution image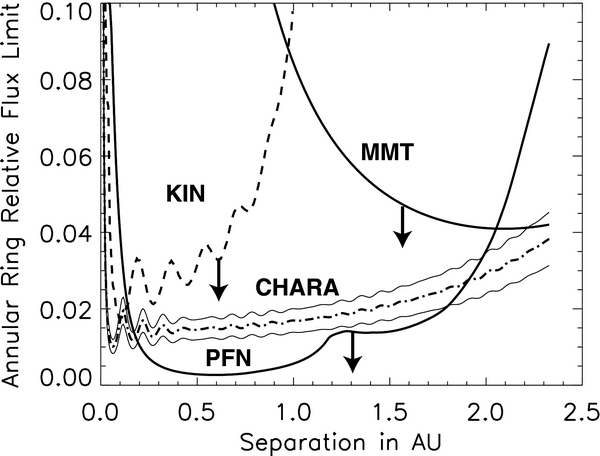
Figure 5. Flux constraints (relative to Vega) of a geometrically thin annular dust ring located at various stellocentric distances. The CHARA dash-dotted curve (with its bracketing ±1σ boundaries) is derived from the excess reported at K band (Absil et al. 2006). All other curves are upper limits (3σ) derived from the KIN (9 μm), MMT (10.6 μm), and PFN (K band) null measurements. Assuming no significant changes in the dust distribution between 2005 and 2009, the PFN data constrain the CHARA NIR excess to reside either within ≃0.2 AU and/or outside of ≃2 AU of Vega.
Download figure:
Standard image High-resolution imageFor the CHARA (full K-band) data, we take into account the transmission pattern of a single-mode fiber optimized for coupling the light of a 1 m telescope (FWHM ≃ 500 mas), the interferometric fringe pattern (34 m baseline), and the coherence loss effects at the edge of the field. The dashed dotted curve of Figure 5 shows the resulting excess flux detected—and its ±1σ boundaries—as a function of ring separation. The CHARA data alone hardly constrain the location of the excess within FLUOR's field of view. However, the constraints from the PFN (Figure 5) clearly show that any significant NIR excess (e.g., compatible with the CHARA data) must originate from within ≃0.2 AU, and/or from farther away than ≃2 AU. We now examine hereafter these two possibilities in more detail, assuming that Vega's brightness distribution did not change significantly between the 2005 May CHARA observations and the 2009 July PFN ones. Otherwise, no meaningful comparison can be made.
3.3. Interpretation
From the CHARA excess detection, and from Vega's tabulated flux, we can compute the corresponding absolute 2.2 μm flux of a narrow circumstellar ring, as a function of its distance to the star. Similarly, from the KIN and MMT upper limits, we calculate the (3σ) upper limits to the absolute flux contributed by a dust ring around Vega (at 9 μm for KIN and at 10.6 μm for the MMT). From these NIR flux levels and from the MIR upper limits, we derive the "minimum" near to mid-infrared ring flux ratio compatible with the data (plain curve; Figure 6, left). In comparison, the dashed curve shows the NIR/MIR flux ratio expected from dust emitting like a blackbody at thermal equilibrium with the star, i.e., with a temperature radial profile going as L0.25/r0.5. For the stellar luminosity L, we use Vega's equatorial plane flux computed in Aufdenberg et al. (2006, their Table 3), and find an equivalent luminosity of 28.9 L☉. This value is smaller than Vega's observed—nearly pole-on—37 L☉ luminosity because of the large temperature gradient between the pole and the equator. For any realistic dust ring radius (i.e., T < 2000 K and r ⩾ 0.1 AU), the minimum NIR/MIR flux ratio observed is found to be significantly larger than that derived from a simplistic blackbody assumption. Considering a dust temperature profile decreasing more slowly than in the blackbody case, as observed for instance in the solar system zodiacal cloud by COBE/DIRBE (T(r) ∝Lδ/2/rδ with δ = 0.467; Kelsall et al. 1998), the predicted flux ratio is even lower (Figure 6, left; dotted curve). Thus, relative to a single-temperature blackbody or gray body, either the MIR emission must be suppressed (by e.g., a low MIR emissivity), or the NIR emission must be strongly enhanced (e.g., by scattering) to be detected by CHARA.

Figure 6. Left: near to mid-infrared flux ratio of a geometrically thin dust ring located at various distances from Vega. Plain curve: minimum value consistent with the CHARA, KIN, and MMT data. Dashed curve: value predicted for dust emitting as a blackbody in thermal equilibrium with the star. Dash-dotted curve: value predicted for dust emitting as a gray body with a (slower) dust temperature profile analogous to the solar system case. The latter two curves assume for Vega an equatorial luminosity of 28.9 L☉. Right: minimum near- to mid-infrared emissivity ratio compatible with the data, assuming pure thermal emission from a geometrically thin ring (plain curve: blackbody model, dash-dotted curve: gray body model). For ring separations larger than ≃0.6 AU, the emissivity ratio takes values larger than predicted by a λ−2 power law (horizontal dashed line), pointing to a non-thermal emission process.
Download figure:
Standard image High-resolution image3.3.1. Thermal Emission
Detailed Mie calculations show that the emissivity of a spherical dust particle is roughly unity at wavelengths shorter than 2πa, where a is the radius of the particle, falling off as λ−n, with n ≃ 1–2, at longer wavelengths. If the ring infrared brightness were dominated by thermal emission rather than scattering effects, Figure 6 (right) shows that beyond about 0.6 AU, the minimum NIR/MIR emissivity ratio required exceeds the value expected from a λ−2 emissivity law (the steepest emissivity decline predicted by Mie theory). The possibility of thermal emission from dust located farther than 2 AU is then ruled out. The CHARA observed excess would have to arise from a very narrow region, located between the sublimation radius (0.1–0.15 AU, given the uncertainties on grain properties and Vega's equatorial flux) and the 0.2 AU upper limit set by the NIR PFN data. In addition, we find (Figure 6, left) that the NIR/MIR emissivity ratio must be greater than 3 everywhere between 0.1 and 0.2 AU to fit the data, and likely a few times higher since this is a 3σ lower limit. This implies dust grains significantly smaller than the MIR wavelength, i.e., micron-sized or smaller.
This implication is quite different from the case of our own zodiacal disk, for which a flat opacity spectrum until 150 μm implies a significant population of larger (≃10–100 μm) grains (Fixsen & Dwek 2002). Any ring-like distribution of small grains around Vega would thus differ significantly from our own zodiacal disk in spatial distribution and grain size. The small size of the grains is surprising, as radiation pressure is expected to expel small grains rapidly to tens or hundreds of AU. One possibility is that the small grains are not expelled effectively by radiation pressure, a case that arises if the grains are predominantly very non-spherical or extremely small. This would for instance happen for grains similar in size to the nano (1–10 nm) dust particles trapped near the Sun and recently detected by the STEREO spacecraft (Mann et al. 2010). In this case the bright emission ring would be located near the sublimation radius, as we find. Another possibility is that evaporating comets and small grains are continuously fed to the inner region because of dynamical perturbations and collisions in the outer colder disk of Vega, induced for instance by migrating planets. The resulting dust would then be transported inward by Poynting–Robertson drag and strong stellar winds, as recently suggested around  Eri (Reidemeister et al. 2011). In a more speculative vein, abundant close-in small grains may on the other hand correspond to a bright turnaround region: as larger grains fall inward due to Poynting–Robertson drag, they encounter increasing collision rates, leading to decreasing grain sizes and increasing emission, until the grains become small enough for radiation pressure to dominate and expel them. Finally, the ring-like distribution may instead signify clearing or shepherding by nearby planets.
3.3.2. Starlight Scattering
Conversely, if scattering strongly dominates over thermal emission at NIR wavelengths, and is much less efficient at MIR wavelengths, both the inner (<0.2 AU) and outer (>2 AU) dust populations are a priori compatible with the data. A complete simulation of dust properties is necessary to explore these two possibilities, and will be carried out in an upcoming paper including both the H-band interferometric measurements obtained with IOTA/IONIC (Defrere et al. 2011) and new K-band observations with CHARA/FLUOR. However, from a first analysis based on astronomical silicates (Draine & Lee 1984), small grains—typically micron-sized or smaller—seem again necessary to produce strong scattering efficiency enhancement in the NIR. Finally, we note that if starlight scattering was responsible for a significant (>1%) NIR excess emission, it would essentially have the same color as Vega, and may have well remained undetected before the spatially resolved high accuracy CHARA observations.
4. CONCLUSIONS AND PERSPECTIVES
Using the PFN and the null self calibration technique, we have demonstrated high contrast direct detection capabilities within the diffraction limit at the Palomar Hale telescope. We presented the deepest stellar nulls measured to date in the NIR (0.0008 ± 0.0004), providing new constraints on exozodiacal emission in the inner few AU around Vega. In particular, our data show that, if present at all, any significant (⩾1%) source of extended NIR excess must either be confined very close to the dust sublimation radius (and arise in either scattering or thermal emission), and/or come from a colder grain population located beyond 2 AU (compatible with scattering only). The absence of a corresponding MIR excess implies that such a NIR excess would most likely come from very small grains, micron-sized or smaller.
Accurate ground-based nulling measurements have so far been limited to the mid-infrared, where one takes advantage of the reduced turbulence and improved wavefront quality. The results reported here demonstrate that although shorter wavelengths have intrinsically higher phase fluctuations, high contrast interferometry is also possible in the near-infrared, providing higher spatial resolution and much better sensitivity from the ground. With ongoing developments to improve the nuller sensitivity, and with the PALM-3000 extreme AO system (Bouchez et al. 2008) coming online at Palomar later this year, simulations indicate that contrasts of the order of 10−4 to 10−3 should be readily accessible with the PFN system on mK = 3 stars to mK = 6 stars, as close as 30 mas from the central star (Mennesson et al. 2010; Serabyn et al. 2010). We plan to use these capabilities to conduct a survey of faint companions around nearby young stars, and hot exozodiacal dust around nearby A stars at Palomar. Additionally, we note that the fiber nuller and null self-calibration techniques can in principle be extended to long baseline interferometers, as long as moderate fringe tracking and dispersion capabilities are available (B. Mennesson 2011, in preparation). As a result, 10−3 contrast or better should also be accessible at much higher spatial resolution. This opens up the possibility of extending the high contrast NIR exozodi survey to nearby FGK main-sequence stars, where hot dust is expected at smaller separations.
This work was performed at the Jet Propulsion Laboratory, California Institute of Technology, under contract with NASA. The data presented are based on observations obtained at the Hale Telescope, Palomar Observatory, as part of a continuing collaboration between Caltech, NASA/JPL, and Cornell University. We thank the Palomar Observatory staff for their assistance in mounting the PFN and conducting the observations at the Hale telescope.
Footnotes
- *
Based on observations obtained at the Hale Telescope, Palomar Observatory as part of a continuing collaboration between the California Institute of Technology, NASA/JPL, and Cornell University.
- 3
The astrophysical null depth is given by
 , where V is the object's complex visibility.
