


ABSTRACT
The sector structure that organizes the magnetic field of the solar wind into large-scale domains has a clear pattern in the photospheric magnetic field as well. The rotation rate, 27–28.5 days, implies an effectively rigid rotation originating deeper in the solar interior than the sunspots. The photospheric magnetic field is known to be concentrated near that portion (the Hale boundary) in each solar hemisphere, where the change in magnetic sector polarity matches that between the leading and following sunspot polarities in active regions in the respective hemispheres. We report here that flares and microflares also concentrate at the Hale boundaries, implying that flux emergence and the creation of free magnetic energy in the corona also have a direct cause in the deep interior.
Export citation and abstract BibTeX RIS
1. INTRODUCTION
The magnetic field of the solar wind has a large-scale domain structure, the sectors, in which the radial field component either points away from the Sun or toward it: by convention, either a positive (+) or a negative (−) sector (Wilcox & Ness 1965). The heliospheric current sheet separates the sectors. When the heliospheric current sheet overtakes the Earth (or a spacecraft) an abrupt change of magnetic polarity occurs: a sector boundary. Typically, magnetic observations at the position of the Earth (space- or ground-based) show two or four sectors per solar rotation, the fact that led to the "ballerina skirt" analogy for the warps of the heliospheric current sheet. A sector boundary observed at Earth maps back to a magnetic neutral line at central meridian (CM) in the solar corona, conceptually at a low heliospheric latitude, and also to the originating photospheric magnetic field about 5 days earlier (roughly the transit time of the solar wind). The large-scale neutral line in the photosphere corresponding to the sector boundary is on average meridional, i.e., along a line of longitude (Svalgaard et al. 1975).
Separate from this large-scale structure, active regions also have photospheric neutral lines, often multiple. In the simple case of an active region with well-divided leading and following polarities, a unique active-region neutral line presents opposite polarities in opposite hemispheres (Hale's law). The portion of a sector-boundary neutral line where the polarity change is the same as that for an active region is called a Hale boundary (Svalgaard & Wilcox 1976). The Hale boundary switches polarities across the solar equator, as illustrated in Figure 1. Svalgaard & Wilcox (1976) showed that above a Hale boundary, the green-line (Fe xiv) corona has a maximum in brightness, while above a non-Hale boundary, the green-line corona has minimum brightness. Using synoptic maps of the magnitude of the photospheric field strength observed at Mt. Wilson Observatory during 1967 to 1973 Svalgaard and Wilcox also found that the unsigned magnetic field flux is at a maximum at the Hale boundary, matching the green-line coronal brightness.

Figure 1. Schematic of the solar disk showing the portion of a sector boundary that is designated a Hale boundary, i.e., that portion of a sector boundary that is located in the solar hemisphere in which the change of magnetic polarity across the sector boundary is the same as the change of magnetic polarity from a preceding spot to a following spot. The spot polarities shown in the small circles correspond to even-numbered cycles, e.g., cycle 24 (Svalgaard & Wilcox 1976).
Download figure:
Standard image High-resolution imageThe large-scale structure of the heliospheric field, reflected in the photospheric organization shown by the large-scale neutral line, appears to originate in the deep interior of the Sun. Otherwise it would be difficult to explain the apparently rigid rotation of this structure. This likelihood immediately presents an interesting contrast with the clear association of the sector structure with the active corona, as noted above, since solar activity has a definite association with the differential rotation (Babcock 1961). In this paper, we extend the analysis of photospheric signature of the sector structure. Section 2.1 describes this effect using the full history of magnetograms from the Wilcox Solar Observatory (WSO). In Section 2.2, we add a new analysis confirming that flare occurrence patterns, as derived both from the NOAA database and from the data of the Reuven Ramaty Solar Spectroscopic Imager (RHESSI) spacecraft (Lin et al. 2002), also correlate with the Hale boundaries (cf. Dittmer 1975). The occurrence of flaring within this morphological framework suggests a particular property of flux emergence from its ultimate source in the dynamo. We discuss this in Section 3.
2. OBSERVATIONS
2.1. Magnetic Field
We have extended the analysis of the large-scale distribution of line-of-sight magnetic field in the photosphere using all available data from the WSO. At WSO (http://wso.stanford.edu/) magnetograms using the 525 nm Fe i line are obtained on every day with a sufficiently clear sky. Conditions permitting, several magnetograms may be secured on a given day. Observational details can be found elsewhere: Scherrer et al. (1977), Svalgaard et al. (1978), and Duvall et al. (1979). The resulting magnetogram is a 21 × 21 array oriented north–south on the Sun and has not been remapped to any other coordinate system. In the analysis we ignore the annual variation of latitude of disk center; this gives rise to less than 1% effect on the measured field (Duvall et al. 1979). The magnetograms show the line-of-sight magnetic flux density over the 3' aperture of the instrument and are not corrected for magnetograph saturation.
We superpose full-disk magnetograms from the times where a sector boundary was within one day of CM,4 using data from 1976 through 2010. In the superposition we take advantage of the polarity changes and treat (−, +) boundaries as (+, −) boundaries by reversing the sign of the magnetic field, and of the Hale magnetic cycle by reversing latitudes between cycles to construct a nominal magnetogram for a (+, −) Hale boundary from the average over solar cycles 21–24 shown in Figure 2. This manipulation is just to allow all of the data to be shown on a single figure conveniently and has no physical significance.
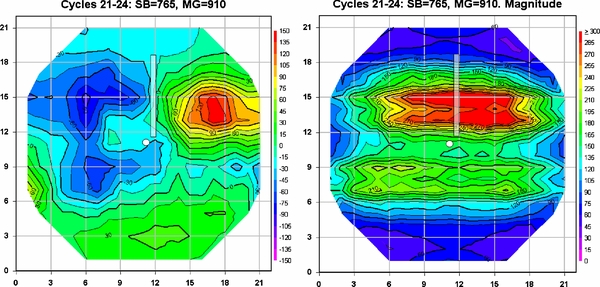
Figure 2. Average magnetograms for a nominal (+, −) Hale boundary during solar cycle 23 (+ by convention means radially out of the Sun). A total of 910 magnetograms were superposed on 765 sector boundaries (mapped back on the Sun) using the Wilcox Solar Observatory observations 1976–2010. The data have been appropriately mirrored and sign-reversed as described in the text to reduce all data to the situation for cycle 23. The Hale portion of the sector boundary is marked by the semi-transparent bar. The left panel shows the average signed field, while the right panel shows the average unsigned (total) field.
Download figure:
Standard image High-resolution imageThis association makes it clear that, on average, the warps in the current sheet (and hence in the sector boundary at Earth) originate strongly from one hemisphere, namely that which has the Hale boundary (the northern in Figure 2). Coronal holes are often found co-located with the interiors of the sectors, but their boundaries otherwise do not have a well-understood relationship with the sector boundaries (cf. Antiochos et al. 2007; Titov et al. 2011). One important (and perhaps the only) source of the open flux is the flux dispersed from the active regions with strong magnetic fields, so we expect a concentration of total flux at the Hale boundary as shown in the right-hand side of Figure 2. The closed field lines associated with the active regions would trap coronal material, explaining the enhanced brightness of the green-line corona at Hale boundaries.
2.2. Flares
We may also expect flares and microflares to occur preferentially near the Hale boundary (Dittmer 1975). The RHESSI flare list5 catalogs times of all significant increases in X-ray flux detected above 3 keV, subject to the orbital restrictions of the satellite (low Earth orbit at about 37° inclination). The RHESSI modulation collimators (Hurford et al. 2002) allow the position of each of these events to be found to an accuracy of a few arcsec. The RHESSI flare list covers the largest GOES > X10-class flares down to A-class microflares (10−3 to 10−8 W m−2 in terms of GOES 1–8 Å flux). Because it is based on hard X-ray bursts, which have shorter durations than soft X-ray bursts, there is less of a dead-time effect produced by enhanced solar background fluxes. This effect is not completely eliminated in the RHESSI catalog, but this list goes to fainter levels than a catalog based on GOES data. A particular instrumental bias in the RHESSI event list is the deficiency of events about the location of spacecraft pointing, a kidney-shaped region slightly west of disk center (dashed circles in Figure 3; see also Figure 4 of Christe et al. 2008). RHESSI's imaging method uses rotation modulation collimators, so flares close to where this imaging axis is pointing will have their location poorly determined and are not included in the flare list. For the RHESSI microflare study it was estimated that less than 2% of events were affected by the imaging-axis problem (Christe et al. 2008). Note that to first order this heliocentric bias would not show up in the longitude distributions of flares; the RHESSI blind spot moves slightly N and S following Earth's orbit and this motion tends to cancel out the effect on the latitudes of sector-boundary epochs.

Figure 3. Distribution of RHESSI flares within ±24 hr of 223 sector boundaries mapped back to central meridian (dashed vertical line) for part of solar cycle 23, 2002 March to 2008 March. The left and right panels show the (−, +) and (+, −) boundaries, respectively. The green boxes show where flares are expected, based on association with strong magnetic fields, i.e., at the Hale boundary. The dashed purple boxes show that hardly any flares occur near a non-Hale boundary. The number of flares in each distribution is shown above each plot. Only flares within ±85° of CM are counted. The small dashed line circles show the center of the bias area for the RHESSI imaging axis.
Download figure:
Standard image High-resolution image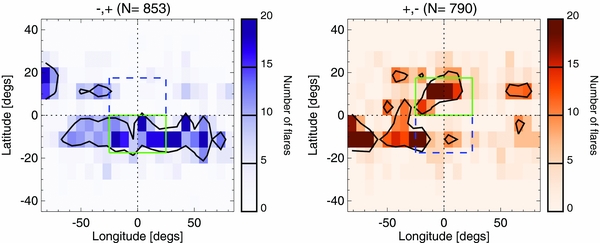
Figure 4. Distribution of NOAA flares within ±24 hr of 392 sector boundaries mapped back to central meridian (dashed vertical line) for solar cycle 23, 1996 May through 2008. The left and right panels show the (−, +) and (+, −) boundaries, respectively. The green boxes show where flares are expected, based on association with strong magnetic fields, i.e., at the Hale boundary. The dashed purple boxes show that hardly any flares occur near a non-Hale boundary. The number of flares in each distribution is shown above each plot. Only flares within ±85° of central meridian are counted.
Download figure:
Standard image High-resolution image
Using the RHESSI list of hard X-ray flares (41,338 events) covering the interval 2002 March to 2009 January (about half of cycle 23) we confirm that flare occurrence follows the Hale boundary. Figure 3 shows the superposed-epoch analysis on sector boundaries for the RHESSI flare catalog. The green boxes show where flares would expected, based on association with strong magnetic fields, i.e., in the region of the Hale boundary. The dashed purple boxes show the non-Hale-boundary region and reveal a deficit of flare occurrence there.
The NOAA flare listings6 for solar flares contain 8228 events for the interval 1996 May to 2009 January (cycle 23) that show the same distribution (Figure 4). This sample only goes down to the GOES B1-class, 10−7 W m−2, about an order of magnitude larger than the smallest events in the RHESSI flare list. However, both catalogs have ample events to demonstrate the Hale-boundary effect. An early and more limited analysis by Dittmer (1975) also concluded that flares preferentially occur near sector boundaries whose polarity agrees with that of bipolar active regions, as given by the Hale polarity laws. Already Bumba & Obridko (1969) had found that flares and especially "proton" flares tend to occur near sector boundaries, and Grigoryev et al. (1986) found that toroidal magnetic flux emerges preferentially at Hale boundaries.
Figures 3 and 4 clearly show organization on the Hale sector boundary, but not perfectly. On the hemisphere away from that containing the Hale sector, this pattern may appear to be slightly less clear. This reflects the variability of the sector boundaries; the distance between them is not constant and in this work is crudely determined to the nearest day only.
3. DISCUSSION
The analyses described above confirm earlier studies but with much larger databases and more accurately determined positions. We have thus firmly established the association of magnetic activity in general, and flaring, with the Hale boundaries of the interplanetary sector structure. Because the sector structure rotates rigidly, we argue that these correlations link the large-scale heliospheric magnetic field with the deep-seated source of solar magnetism, implying that many of the motions seen in the photosphere, such as the differential rotation of sunspots, in fact must arise in the outermost layers of the solar convective envelope.
It is also possible to argue, following Dittmer (1975), that local effects associated with a Leighton-type model of flux dispersal from active regions (Leighton 1969) could explain the correlation of flaring with Hale boundaries. Dittmer suggested that the rate of dispersal might depend upon the proximity to the boundary, hence concentrating flares if appropriate. One could presumably also make an argument involving magnetic reconnection; such effects have been sought but not convincingly observed at the boundaries of coronal holes (e.g., Kahler & Hudson 2002). At these boundaries as well, reconnection is required at the "closing" boundary to permit the rotation to appear rigid. Flare occurrence does correlate well with local properties within active-region fields (e.g., Falconer et al. 2002; Schrijver 2007), but it is only known to do so on timescales short relative to the evolution of the global field (i.e., the sector structure).
Accordingly we prefer the first idea, namely that the association of flaring with the Hale boundary is not a property of the surface fields and their detailed interactions, but instead is intrinsic to the nature of the emerging flux. McClymont & Fisher (1989) make this case generally; note that this point of view opposes the idea that photospheric motions as such can contribute to flare energy storage. Instead the emerging flux adds stressed magnetic fields directly to the lower solar atmosphere, storing the non-potential energy needed for flaring. Studies suggest that the residence time of this energy is of order 1 day in the case of major flares (e.g., Schrijver 2007), but the physics of this latency remains little understood. In this picture, the flux emerging at or near the Hale boundary preferentially has more stress and thus generates more flares. Dittmer (1975) in fact notes that Ca plage regions do not show the Hale-boundary aggregation that flares do; this would be consistent with the idea that the Hale-boundary effect is associated with stress in the field observed at the photosphere, rather than just the magnetic flux in active regions.
4. CONCLUSION
We have confirmed, with far better databases, the association of large-scale photospheric magnetism and flare occurrence with the Hale boundaries of the interplanetary sector structure. The patterns we report emphasize the high degree of coherence in the organization of solar magnetic activity on large scales, something that may not be well understood theoretically, but which presumably links the sector structure to the deep interior of the Sun. The solar sector structure is organized and long-lived, and we have found that flaring also has the same degree of spatial and temporal structure. Because the heliospheric sector structure has a strong dipole component (the dipole moment of a simple bipolar but radial field is about 0.7), this presumably reflects a similar property in the creation of solar magnetism or its propagation to the surface.
The observations described here have an obvious application to the prediction of flare occurrence in a statistical sense. The linkage between the sector structure (the global heliospheric field) and the preferential emergence of stressed field could perhaps be tested by simulations of interior magnetic energy transport in the thin flux tube approximation (e.g., Fan 2009).
We are grateful to the staff of the Wilcox Solar Observatory and to the funding agencies that have made this exceptional data set possible. WSO magnetograms are available on request from http://wso.stanford.edu/. The sector boundary list can be downloaded from the WSO site at http://wso.stanford.edu/SB/SB.Svalgaard.html. The RHESSI flare list can be found at http://hesperia.gsfc.nasa.gov/hessidata/dbase/hessi_flare_list.txt. H.S.H. thanks NASA for support under grant under contract NAS5-98033 for RHESSI. I.G.H. is supported by an STFC rolling grant and the European Commission through the SOLAIRE Network (MTRN-CT-2006-035484).
Facilities: WSO - The Wilcox Solar Observatory, RHESSI - Ramaty High Energy Solar Spectroscopic Imager satellite
Footnotes
- 4
See http://www.leif.org/research/sblist.txt for the list of sector boundaries, 1926–present.
- 5
- 6