


ABSTRACT
We present measurements of 5–25 μm emission features of brightest cluster galaxies (BCGs) with strong optical emission lines in a sample of nine cool-core clusters of galaxies observed with the Infrared Spectrograph on board the Spitzer Space Telescope. These systems provide a view of dusty molecular gas and star formation, surrounded by dense, X-ray-emitting intracluster gas. Past work has shown that BCGs in cool-core clusters may host powerful radio sources, luminous optical emission-line systems, and excess UV, while BCGs in other clusters never show this activity. In this sample, we detect polycyclic aromatic hydrocarbons (PAHs), extremely luminous, rotationally excited molecular hydrogen line emission, forbidden line emission from ionized gas ([Ne ii] and [Ne iii]), and infrared continuum emission from warm dust and cool stars. We show here that these BCGs exhibit more luminous forbidden neon and H2 rotational line emission than star-forming galaxies with similar total infrared luminosities, as well as somewhat higher ratios of 70 μm/24 μm luminosities. Our analysis suggests that while star formation processes dominate the heating of the dust and PAHs, a heating process consistent with suprathermal electron heating from the hot gas, distinct from star formation, is heating the molecular gas and contributing to the heating of the ionized gas in the galaxies. The survival of PAHs and dust suggests that dusty gas is somehow shielded from significant interaction with the X-ray gas.
1. INTRODUCTION
Infrared spectroscopy provides critical clues about the power sources of luminous galaxies whose energy sources are shielded from visual inspection by layers of dust and gas (Genzel et al. 1998; Kennicutt 1998; Laurent et al. 2000), including star formation activity and active galactic nucleus (AGN; e.g., Roussel et al. 2001). The Infrared Spectrograph (IRS) on board the Spitzer Space Telescope (Houck et al. 2004), exploiting the sensitivity and spatial resolution of Spitzer, delivered stunning infrared spectra from galaxies of many types. A key project, Spitzer Infrared Nearby Galaxy Survey (SINGS; Kennicutt et al. 2003), as a survey of nearby galaxies (D < 30 Mpc), was limited to mainly spirals and a few ellipticals. Studies targeting the brightest infrared galaxies in the sky (e.g., Armus et al. 2009) included mainly the most luminous IR galaxies (LIRGs) and nearby IR-bright, star-forming galaxies. Spitzer programs such as these have produced a treasure of infrared spectra of galaxies as well as improved and standardized techniques for measuring infrared features (e.g., Dale et al. 2009). These recent theoretical and observational efforts have identified useful infrared diagnostics, which now allow a physical interpretation of the spectra based on models (Dale et al. 2006; Farrah et al. 2007; Smith et al. 2007b).
We explore here the infrared spectral signatures of brightest cluster galaxies (BCGs). BCGs are not common even in large samples of galaxies, because massive clusters themselves are rare (of order a few in a box 100 Mpc on a side), so in general, to study an interestingly large and bright sample of BCGs, they must be specially targeted. Although most BCGs have red colors and are dust free, suggesting little star formation, some 15%–25% show evidence of significant star formation (rates up to ∼100 M☉ yr−1) in their UV and optical continua (e.g., Johnstone et al. 1987; McNamara & O'Connell 1989; Fabian 1994; Crawford et al. 1999; Hicks & Mushotzky 2005; Rafferty et al. 2008; Bildfell et al. 2008; Hicks et al. 2010; Donahue et al. 2010).
Star-forming BCGs seem to be exclusively found in the centers of clusters whose hot intracluster medium (ICM) cores exhibit gas cooling times shorter than about 1 billion years or low hot gas entropies (K) where K = kTn−2/3e < 30 keV cm−2 (e.g., Cavagnolo et al. 2008; Rafferty et al. 2008; Hudson et al. 2010). These clusters, once known as cooling flows, are called "cool-core" clusters. About half of the nearby X-ray luminous clusters fall into this category. This trend for cooling flow clusters to host BCGs with powerful emission-line nebulae was first found by Hu et al. (1985), who noted a ∼14 billion year threshold, limited by the far cruder X-ray data available at the time. Then, astronomers suspected that gas cooling from the hot phase was somehow related to these nebular emission-line systems although the emission lines themselves were too bright to be generated directly by cooling gas. Almost two decades later, X-ray Multi-Mirror (XMM) spectroscopy failed to show [Fe xvii] and [O vii] emission lines, conclusively demonstrating that very little X-ray emitting gas existed at temperatures 1/2–1/3 the temperature of most of the ICM (e.g., Peterson et al. 2003). However, the disproof of the simplest massive cooling flow model did not explain why BCGs in these systems frequently exhibited properties indicative of activity: extended emission-line systems (Heckman et al. 1989), including vibrationally excited molecular hydrogen at 1000–2000 K (Elston & Maloney 1994; Jaffe & Bremer 1997; Donahue et al. 2000), CO masses indicating cold H2 at ∼100 K (Edge 2001), UV excesses (most recently; O'Dea et al. 2010; Hicks et al. 2010; Donahue et al. 2010), radio sources (e.g., Burns 1990; Cavagnolo et al. 2008; Mittal et al. 2009), and IR emission from warm dust (Egami et al. 2006b; Donahue et al. 2007b; O'Dea et al. 2008). It is important to note that the XMM spectral results ruled out the enormous X-ray cooling rates inferred from the simple cooling flow model (∼100s M☉ yr−1), but do not provide limits near the cooling rates similar to the typical star formation rates (SFRs) estimated for these BCGs (∼1–10s M☉ yr−1), with quantities an order of magnitude higher for the most extreme systems. Early Herschel results of a few classic examples of these active BCGs in cool-core clusters reveal far-IR spectra of similar sources that are consistent with the short-wavelength Spitzer observations: strong peaks in broadband photometry from dust warmed by recently formed stars and powerful interstellar coolant lines of O i (63 μm) and C ii (153 μm) (Edge et al. 2010a, 2010b), and Spitzer IRS measurements of individual BCGs reveal that some, like Zwicky 3146, have not only have powerful IR emission from warm dust but unusually luminous molecular hydrogen (Egami et al. 2006a), while others, like NGC 4696, have luminous molecular hydrogen but only faint dust emission (Kaneda et al. 2008).
These BCGs also pose a challenge to galaxy formation models. The so-called overcooling problem in galaxy formation simulations creates massive galaxies that are bluer, even more luminous, and with higher SFRs than observed (see Balogh et al. 2001; Croton et al. 2006; Bower et al. 2006). To remedy this situation, models must include AGN feedback in the form of non-radiative energy in addition to stellar feedback to quench the formation of stars (e.g., Springel et al. 2005) and prevent the rapid cooling of hot intergalactic gas (e.g., Churazov et al. 2001; McNamara & Nulsen 2007). Furthermore, the accretion of hot gas has been proposed as the dominant mode for forming the most massive (>1011.4 M☉) galaxies (e.g., Kereš et al. 2005).
Conveniently, BCGs provide a laboratory for this type of galaxy formation. Chandra observations clearly show AGN interactions with the hot ICM in the form of cavities in the hot atmospheres of clusters and galaxies. The mechanical energy associated with these cavities is sufficient to offset cooling (Bîrzan et al. 2004; Dunn & Fabian 2006) and to somehow regulate or quench star formation in most systems (Rafferty et al. 2006). However, energetic AGN feedback is apparently unable to offset cooling entirely in all BCGs, and these systems that are struggling to offset rapid cooling are rich in cold gas and star formation (O'Dea et al. 2008). The correlation between star formation and short central cooling times in the hot gas shows that the gas fueling star formation may well have cooled from the hot ICM (Cavagnolo et al. 2008; Rafferty et al. 2008). Assessing and decoding the state of gas, dust, and stars in these galaxies, using Spitzer spectra, will yield clues about which physical processes are most relevant in determining a system's appearance and SFR during accretion of hot gas.
We present here Spitzer IRS (Houck et al. 2004) measurements of a sample of nine BCGs residing in cool-core clusters. We describe the measurement procedures, including the scaling we applied to the data to match aperture photometry, in Section 2. We present our results in Section 3. In Section 4, we compare the full spectra to a set of simulated time-averaged starburst spectral energy distributions (SEDs). In Section 5, we compare the emission line and polycyclic aromatic hydrocarbons (PAHs) ratios and correlations seen in our sample to those seen in other types of galaxies. In Section 6, we discuss the correlation and lack of correlation in the various spectral components that suggest that at least two sources of heat must be considered in order to interpret the observations of these systems. We assume H0 = 70 km s−1 Mpc−1, and a flat, ΩM = 0.3 cosmology throughout.
2. OBSERVATIONS AND DATA REDUCTIONS
2.1. Observations
The Spitzer IRS observations took place in 2005 and 2006 (see Table 1), and the data were reprocessed in 2009 April (v18.7). Both short (SL) and long (LL) wavelength observations were obtained, at low spectral resolution, R ∼ 60–130. With two spectral orders each, we obtained a total of four spectral modules. We have sparse spectral maps of nine cool-core BCGs, though we analyze only the central region here. We used IRSCLEAN v1.7 to apply the bad pixel mask supplied by the Spitzer pipeline and to find additional rogue pixels using a WCLEAN formula with an aggressive level of 0.5 (suitable for relatively faint targets such as these). The LL pixels are 5 1 across, while the SL pixels are 18 across (Houck et al. 2004).
Table 1. Observation Log
| Cluster | Redshifta | Spitzer | IRS Mode | Obs. Date | Duration (s) | No. of Slit Positions | ||
|---|---|---|---|---|---|---|---|---|
| BCG | ID | SL | LL | SL | LL | |||
| 2A0335+096 | 0.0347 | 20345 | Staring | 2006 Sep 16 | 10156 | 1698 | 12 | 12 |
| A478 | 0.0860 | 20345 | Staring | 2006 Mar 17 | 10156 | 1698 | 12 | 12 |
| A1068 | 0.1386 | 3384 | Mapping | 2005 Apr 21 | 2925 | 234 | 6 | 2 |
| A1795 | 0.0633 | 3384 | Mapping | 2005 Feb 7 | 11701 | 1879 | 24 | 16 |
| A1835 | 0.2520 | 3384 | Mapping | 2005 Feb 13 | 2925 | 234 | 6 | 2 |
| A2597 | 0.0821 | 3384 | Mapping | 2005 Jun 30b | 6826 | 704 | 14 | 6 |
| Hydra A | 0.0549 | 3384 | Staring | 2005 Dec 14 | 7313 | 1509 | 12 | 12 |
| MS 0735.6+7421 | 0.216 | 20345 | Staring | 2006 Apr 25 | 21280 | 2768 | 4 | 4 |
| PKS 0745-19 | 0.1028 | 20345 | Staring | 2006 May 16 | 10640 | 1384 | 4 | 4 |
Notes. aBCG redshift sources, from emission lines: 2A0335+096 (Donahue et al. 2007a), Hydra A (Smith et al. 2004), A1795 (CGCG 162-010; Hill & Oegerle 1993), A2597 (PKS 2322-12; Voit & Donahue 1997; Colless et al. 2003), see also http://www.mso.anu.edu.au/2dFGRS/, A478 (NVSS J041325+102754; Zabludoff et al. 1990), PKS 0745-19 (Hunstead et al. 1978), A1068 (FIRST J104044.4+395712; Allen et al. 1992), MS0735 (ZwCl 1370 or BCG 4C +74.12; Stocke et al. 1991), and A1835 (SDSS J140102.07+025242.5; SDSS DR2; see also Allen et al. (1992). bAlso 2005 July 5.
Download table as: ASCIITypeset image
To cross-check our flux calibration of the IRS spectroscopy, we also analyzed photometry data from the Spitzer Infrared Array Camera (IRAC; Fazio et al. 2004) and the from the Multiband Imaging Photometer for Spitzer (MIPS; Rieke et al. 2004). We list the archival observations (known by their Astronomical Observation Requests or AORs) in Table 2. The aperture photometry is discussed in Section 2.3.
Table 2. Spitzer MIPS/IRAC Observation Log
| Cluster | IRAC AOR | Obs. Date | Duration | MIPS AORa | Obs. Date | Durationb |
|---|---|---|---|---|---|---|
| BCG | (s) | (s) | ||||
| 2A0335+096 | 18646528 | 2006 Sep 26 | 108 | 18636544 | 2007 Feb 27 | 400, 300 |
| A478 | 11579904 | 2005 Sep 16 | 1200 | 14944256 (1), 14944512 (2 & 3) | 2006 Feb 22, 2006 Mar 2 | 550, 1500, 1200 |
| A1068 | 18650368 | 2006 Dec 27 | 108 | 18638336 | 2006 Dec 8 | 400, 320 |
| A1795 | ⋅⋅⋅ | ⋅⋅⋅ | ⋅⋅⋅ | 8788480 | 2004 Jul 11 | 36, 42 |
| A1835 | 4404480 | 2004 Jan 16 | 3600 | 4764160(1), 4744448(2 & 3) | 2004 Feb 20, 2005 Jun 28 | 1800, 600, 150 |
| A2597 | 13372160 | 2005 Nov 24 | 3600 | 13371904 | 2005 Jun 18 | 140, 150, 60 |
| Hydra A | 26923008 | 2008 Jun 9 | 3600 | 4707584 | 2004 May 4 | 140, 120, 180 |
| MS0735.6+7421 | 7858688 | 2003 Nov 20 | 500 | ⋅⋅⋅ | ⋅⋅⋅ | ⋅⋅⋅ |
| PKS 0745-19 | 18667776 | 2006 Dec 27 | 108 | 18667520 | 2006 Dec 8 | 400, 300 |
Notes. aChannel 1 is the 24 μm channel, Channels 2 and 3 are the MIPS 70 and 160 μm channels, respectively. bTwo durations indicate total exposure time in seconds for 24 and 70 μm MIPS observations, respectively. Three durations indicate exposure times for 24, 70, and 160 μm MIPS observation sequences, respectively.
Download table as: ASCIITypeset image
2.2. Spectral Data Filtering and Extraction
This section discusses our choices regarding the IRS spectral extraction process, with particular attention to the treatment of extended sources compared to point sources. We used the software package CUBISM v1.77 (Smith et al. 2007a) to combine the exposures into a data cube or spectral map. To reduce noise near the ends of the slit, we trimmed the exposures in the cross-dispersion direction by 3%–5%. We confirmed that the off-target, paired observations for each spectrum were indeed source free. These blank sky spectra were used for background subtraction.
To remove rogue pixels which were not caught by IRSCLEAN, we composed bad pixel lists using CUBISM's autobadpix algorithms, on both the global and individual record levels. At the global level, we flagged any pixel which deviated by more than 2.5σ from the median level in at least 50% of its appearances in the cube. This method flags only a few pixels, but each of these pixels has a relatively large effect on the spectral map. At the record level, we conservatively flagged any pixel which is a 5σ outlier in at least 75% of its appearances in the cube. This method flags more pixels, but only in individual exposures. We also manually removed obvious rogue pixels.
The Spitzer pipeline is optimized for single-slit observations of point sources, including a correction for the light lost from the slit, which can be as much as 36% (Smith et al. 2007a, Figure 4). However, CUBISM includes an option to remove this slit-loss correction factor, in order to extract spectra of extended sources. To determine which targets to treat as point sources, we used CUBISM to create a map combining all SL1 wavelengths and averaged the two rows which covered the peak source emission. Using this light profile, we measured the FWHM along the slit (see Table 3). We did the same for the LL2. These modules were selected because their signal to noise is highest. Spitzer's point-spread function (PSF) has an average FWHM of 26 in the SL and 66 in the LL.8 Four of our nine galaxies have an FWHM in the SL1 of ≲ 55 and were considered to be point sources. The other five sources do not uniformly fill the Spitzer slit, but they are not well characterized as point sources.
Table 3. Parameters Used in Data Reduction
| Cluster | Module | FWHM | FWHM | Type | Aperture Center (J2000) | Aperture Size | θa | Factorb | |
|---|---|---|---|---|---|---|---|---|---|
| ('') | (kpc) | R.A. | Decl. | ('') | (°) | ||||
| 2A0335+096 | SL2 | Extended | 3: 38: 40.5 | 9:58:12 | 10.8 × 10.8 | 17 | 1.16 | ||
| SL1 | 8.0 | 5.7 | 3: 38: 40.6 | 9:58:11 | 10.8 × 10.8 | 17 | 1.16 | ||
| LL2 | 10.5 | 7.5 | 3: 38: 40.4 | 9:58:9 | 30.6 × 15.3 | −80 | 1.01 | ||
| LL1 | 3: 38: 40.5 | 9:58:10 | 30.6 × 15.3 | −80 | 1.01 | ||||
| A478 | SL2 | Extended | 4: 13: 25.4 | 10:27:55 | 7.2 × 7.2 | 14 | 2.26 | ||
| SL1 | 7.0 | 12.3 | 4: 13: 25.4 | 10:27:56 | 7.2 × 7.2 | 14 | 2.26 | ||
| LL2 | 8.4 | 14.7 | 4: 13: 25.3 | 10:27:57 | 15.3 × 10.2 | 8 | 1.71 | ||
| LL1 | 4: 13: 25.3 | 10:27:56 | 15.3 × 10.2 | 8 | 1.71 | ||||
| A1068 | SL2 | Point | 10: 40: 44.5 | 39:57:11 | 12.6 × 5.4 | −40 | 0.65 | ||
| SL1 | 3.7 | 10.6 | 10: 40: 44.4 | 39:57:11 | 19.8 × 3.6 | −40 | 1.00 | ||
| LL2 | 9.0 | 25.6 | 10: 40: 44.7 | 39:57:9 | 35.7 × 10.2 | 43 | 1.00 | ||
| LL1 | 10: 40: 44.6 | 39:57:10 | 56.1 × 10.2 | 43 | 1.00 | ||||
| A1795 | SL2 | Extended | 13: 48: 52.5 | 26:35:33 | 12.6 × 3.6 | −6 | 1.87 | ||
| SL1 | 8.1 | 10.5 | 13: 48: 52.5 | 26:35:34 | 12.6 × 3.6 | −6 | 1.87 | ||
| LL2 | 12.7 | 16.5 | 13: 48: 52.2 | 26:35:35 | 20.4 × 10.2 | 78 | 1.33 | ||
| LL1 | 13: 48: 52.3 | 26:35:36 | 20.4 × 10.2 | 78 | 1.33 | ||||
| A1835 | SL2 | Point | 14: 1: 2.1 | 2:52:41 | 16.2 × 3.6 | −11 | 1.20 | ||
| SL1 | 3.8 | 19.4 | 14: 1: 2.1 | 2:52:42 | 16.2 × 3.6 | −11 | 1.20 | ||
| LL2 | 9.5 | 49.2 | 14: 1: 1.9 | 2:52:40 | 45.9 × 10.2 | 72 | 1.00 | ||
| LL1 | 14: 1: 2.0 | 2:52:39 | 45.9 × 10.2 | 72 | 1.00 | ||||
| A2597 | SL2 | Extended | 23: 25: 19.9 | −12: 7: 27 | 9.0 × 3.6 | 27 | 3.42 | ||
| SL1 | 6.4 | 10.7 | 23: 25: 19.8 | −12: 7: 27 | 9.0 × 3.6 | 27 | 3.42 | ||
| LL2 | 15.0 | 25.3 | 23: 25: 19.7 | −12: 7: 26 | 15.3 × 10.2 | 21 | 1.87 | ||
| LL1 | 23: 25: 19.8 | −12: 7: 26 | 10.2 × 10.2 | 21 | 1.87 | ||||
| Hydra A | SL2 | Point | 9: 18: 5.7 | −12: 5: 43 | 14.4 × 3.6 | −20 | 1.70 | ||
| SL1 | 4.7 | 5.3 | 9: 18: 5.7 | −12: 5: 44 | 18.0 × 3.6 | −20 | 1.70 | ||
| LL2 | 8.7 | 9.7 | 9: 18: 5.4 | −12: 5: 43 | 35.7 × 10.2 | 63 | 1.70 | ||
| LL1 | 9: 18: 5.5 | −12: 5: 44 | 35.7 × 10.2 | 63 | 1.00 | ||||
| MS 0735 | SL2 | Extended | 7: 41: 44.6 | 74:14:39 | 5.4 × 3.6 | −7 | 3.58 | ||
| SL1 | 6.2 | 27.5 | 7: 41: 44.6 | 74:14:39 | 3.6 × 3.6 | −7 | 3.58 | ||
| LL2 | 10.4 | 46.0 | 7: 41: 44.2 | 74:14:39 | 10.2 × 10.2 | −13 | 1.72 | ||
| LL1 | 7: 41: 43.8 | 74:14:39 | 10.2 × 10.2 | −13 | 1.72 | ||||
| PKS 0745-19 | SL2 | Point | 7: 47: 31.4 | −19: 17: 39 | 12.6 × 3.6 | −11 | 3.36 | ||
| SL1 | 4.9 | 10.3 | 7: 47: 31.4 | −19: 17: 36 | 27.0 × 3.6 | −11 | 1.29 | ||
| LL2 | 9.4 | 19.7 | 7: 47: 31.3 | −19: 17: 37 | 25.5 × 10.2 | 72 | 1.00 | ||
| LL1 | 7: 47: 31.2 | −19: 17: 36 | 25.5 × 10.2 | 72 | 1.00 | ||||
Notes. aAngle of longer axis of aperture, in degrees east of north (CCW). bFactor applied to the extracted spectrum to scale it up to the total light in a similar broadband aperture (only for extended-source spectra) and in a few cases to co-register modules and improve agreement with broadband measurements.
Download table as: ASCIITypeset image
For the point sources, we extracted spectra using an aperture that just spans the slit (2 pixels) and a length that captures most of the light along the slit (see Table 3). Spitzer data are calibrated for point sources and for this kind of aperture. Single-pointing software such as SMART9 (Higdon et al. 2004; Lebouteiller et al. 2010) uses a similar aperture with its "tapered column" extraction, increasing the length of the aperture as the PSF broadens with wavelength, and further optimizing the extraction by weighting each pixel by its signal to noise (Lebouteiller et al. 2010). In order to use the same software for all of our spectra, we used CUBISM to extract our point-source spectra, approximating the tapered column type of aperture. (For PKS 0745-19 SL2, we truncated the aperture to avoid a noisy region. For A1068 SL2, CUBISM spreads the light from those two pixels across three rows.) To check our procedure, we also extracted the point-source spectra using SMART and found agreement to within about 10%, sometimes to within 2%.
For the extended targets, we removed the pipeline slit-loss correction factor. Our apertures include much of the available light with good signal to noise. However, our sparse spectral maps do not cover the full extent of the source.
After extraction, any noisy edges were trimmed from each order. In the observed frame, the four low-resolution IRS modules span the following wavelength ranges: SL2: 5.2–7.6 μm, SL1: 7.5–14.5 μm, LL2: 14.3–20.6 μm, and LL1: 20.5–37.5 μm. Spectra extracted from CUBISM are reported in units of MJy sr−1, so the size of the extraction aperture is used to convert spectra to units of flux density (mJy). We then corrected to the rest frame for each target (see Table 1) by dividing both the wavelength and fluxes by a factor of (1 + z).
2.3. Aperture Photometry and Systematic Uncertainties
The light collected by the narrow Spitzer slit and our sparse spectral maps represents only a portion of the MIR light. Therefore, to obtain meaningful luminosities, we rely on IRAC and MIPS photometry (see Table 4; as in Egami et al. 2006a). The broadband aperture diameters are approximately three times the source's FWHM measured using the IRS (or equal to the FWHM of Spitzer's PSF for the 70 and 160 μm points) with subtraction of background computed from a larger annulus. We adjusted the aperture size to exclude unrelated foreground or background sources and applied the suggested aperture corrections given by the MIPS Instrument Handbook. At 24 μm, the corrections are 1.17 (for apertures of 26'' and 30'') and 1.13 (for apertures 50''). For 70 and 160 μm, the corrections are 1.22 and 1.752, respectively. The photometric uncertainty is 5% for IRAC, and 10%, 20%, and 20% for the MIPS 24, 70, and 160 μm points, respectively.
Table 4. Broadband Spitzer Photometry
| Band | 2A0335+096 | A478 | A1068 | A1795 | A1835 | A2597 | Hydra A | MS 0735 | PKS 0745-19 |
|---|---|---|---|---|---|---|---|---|---|
| 3.6 | 9.2 [12] | 4.2 [20] | 2.1 [10] | 2.5 [14] | 4.5 [20] | 1.4 [20] | 3.0 [14] | ||
| 4.5 | 5.6 [12] | 2.8 [20] | 2.0 [10] | 2.0 [14] | 2.9 [20] | 2.9 [14] | 1.0 [20] | 2.1 [14] | |
| 5.8 | 4.4 [12] | 2.0 [20] | 2.7 [10] | 1.3 [14] | 1.8 [20] | 0.7 [20] | 1.7 [14] | ||
| 8.0 | 3.5 [12] | 1.7 [20] | 7.5 [10] | 4.5 [14] | 1.9 [20] | 4.1 [14] | 0.4 [20] | 2.3 [14] | |
| 24.0 | 2.4 [26] | 1.6 [30] | 74.8 [30] | 1.8 [40] | 17.8 [30] | 2.1 [50] | 9.1 [30] | 10.2 [30] | |
| 70.0 | 77.1 [70] | 62.8 [70] | 894.5 [70] | 37.2 [70] | 175.0 [70] | 89.0 [70] | 155.2 [70] | 154.3 [70] | |
| 160.0 | 56.4 [80] | 317.0 [80] | 42.0 [80] | 181.8 [80] |
Notes. IRAC and MIPS waveband centers are in units of μm. Observer-frame fluxes are in units of mJy, and aperture diameters in arcseconds are given in brackets. Photometric uncertainties are ∼5% for IRAC and, for MIPS, 10%, 20%, 20% for 24, 70, and 160 μm, respectively.
Download table as: ASCIITypeset image
Because the spectra within the cited IRAC and MIPS circular apertures may differ from the spectra obtained from within our smaller, rectangular IRS apertures, our analysis and conclusions rely most heavily on relative quantities, i.e., ratios, rather than absolute quantities. All correction factors for each module are listed in Table 3. The interested reader can recover the flux in the apertures listed in Table 3 by dividing the fluxes published here by this factor.
In three cases (Hydra A, A1795, and MS0735), we do not have complete IRAC and MIPS coverage in the IRS wavelength range and needed a robust, standalone scaling procedure. For this purpose, we developed a scaling procedure that did not rely on IRAC or MIPS photometry. We validated this procedure, with scaled IRS spectra for sources with IRAC and MIPS photometry, by comparing the resulting spectrophotometry to IRAC and MIPS photometry. We now describe our scaling procedure.
For the sources we identified as extended, we fit Gaussian, azimuthally symmetric light profiles (and neglected the fainter extended haloes) to estimate how much of the source was included within a circle of the same area as our rectangular aperture. The spatial profile from the SL1 map was used as the reference to determine the scale for the SL1 and SL2 spectra for light from outside the rectangular aperture. The profile from the LL2 map was used for both LL orders. For point sources, this scaling has already been performed by the pipeline (See Section 2.2).
An additional scale factor is needed to match the orders of the IRS spectrum. Flux mismatches are expected between the spectral orders extracted with CUBISM, because it is impossible to perform an exact tapered column extraction using CUBISM. Even tapered column extractions with SMART sometimes show mismatches. In our sample, three targets had mismatches between the first and second orders (SL1/SL2 or LL1/LL2), and three had mismatches between the SL and LL. Some spectra are plagued by noise or decreased signal at the module interface (e.g., 2A0335 near 7.1 μm). We selected the LL2 spectrum as the photometric reference point because of the good agreement between the LL spectrum and MIPS photometry in a similar aperture and because the LL is less vulnerable to slit loss due to pointing errors (because of its larger pixels; Smith et al. 2007a). As mentioned above, the LL2 has superior signal to noise to the LL1. We used low-order polynomial continuum fits to match the modules when major features did not interfere.
In three cases an additional overall factor was needed (Hydra A (1.70), A478 (1.55), and MS0735 (1.12)), probably because of extended halo light contained within the broadband aperture but not represented by our Gaussian profile. This procedure worked well, because agreement between the IRS spectra and broadband photometry was relatively good, almost always within 10%, and usually within 5% (see Figure 1). Therefore, while the IRS spectrum appears to exceed the IRAC value at 8 μm for Hydra A, the agreement between the integrated spectrum and the IRAC photometry point is actually excellent. Note that the comparison here is between the MIPS and IRAC photometry and the observer-frame IRS spectra integrated over appropriate bandpasses. These flux points should not be confused with the integrated IRS photometry in the rest-frame 24 μm MIPS bandpass reported in Table 5.

Download figure:
Standard image High-resolution image
Figure 1. Detailed decompositions of nine cool-core galaxy clusters from 4.3 to 14 μm, utilizing PAHFIT (Smith et al. 2007a). Red lines represent thermal dust components; magenta, the stellar continuum. Their combination is a thick gray line. Broad PAH emission complexes are plotted in blue, and the unresolved emission lines arising from low-ionization or molecular hydrogen emission are plotted in violet and labeled at the top. The full spectral extraction is indicated by the green line, plotted over the rest-frame flux intensities and statistical uncertainties. In the two cases where the empirical PAHFIT detected silicate extinction, the extinction curve is represented with a dotted line using the axis at right; all components are diminished by the extinction. Appropriately transformed IRAC photometry is indicated by cyan squares (see Table 5).
Download figure:
Standard image High-resolution imageTable 5. Line and Continuum Measurements
| Line | 2A0335 | A478 | A1068 | A1795 | A1835 | A2597 | HydraA | MS0735 | PKS0745 |
|---|---|---|---|---|---|---|---|---|---|
| Ne ii 12.8 μm Flux | 17.7 | 17.4 | 47 | 13.0 | 26 | 23.2 | 24.6 | 0.95 | 38.9 |
| Ne ii 12.8 μm Flux Error | ± 0.3 | ± 0.4 | ± 2 | ± 0.3 | ± 4.0 | ± 0.9 | ± 0.6 | ± 0.2 | ± 0.3 |
| Ne ii 12.8 μm Lum | 0.0499 | 0.319 | 2.4 | 0.126 | 5.0 | 0.386 | 0.176 | 0.129 | 1.05 |
| Ne iii 15.5 μm Flux | 11.6 | 8.2 | 28 | 5.63 | 16 | 21 | 22 | <0.5 | 14.3 |
| Ne iii 15.5 μm Flux Error | ± 0.7 | ± 0.6 | ± 1 | ± 0.7 | ± 2.0 | ± 2.0 | ± 1.0 | ⋅⋅⋅ | ± 0.3 |
| Ne iii 15.5 μm Lum | 0.0328 | 0.15 | 1.45 | 0.054 | 3.1 | 0.36 | 0.16 | <0.07 | 0.385 |
| PAH 7.7 μm Flux | ⋅⋅⋅ a | 26 | 300.0 | 28 | 532.0 | 42 | 180 | <4 | 46 |
| PAH 7.7 Flux Error | ⋅⋅⋅ | ± 6 | ± 8 | ± 9 | ± 6 | ± 10 | ± 10 | ⋅⋅⋅ | ± 4 |
| PAH 7.7 Lum | ⋅⋅⋅ | 0.49 | 15.4 | 0.27 | 103.0 | 0.71 | 1.3 | <0.6 | 1.2 |
| PAH 11.3 μm Flux | 31.2 | 17 | 91 | 22 | 132.0 | 16 | 83 | 4.6 | 44.9 |
| PAH 11.3 Flux Error | ± 0.7 | ± 1 | ± 2 | ± 1 | ± 2 | ± 3 | ± 3 | ± 0.3 | ± 0.8 |
| PAH 11.3 Lum | 0.0881 | 0.32 | 4.7 | 0.21 | 25.5 | 0.27 | 0.60 | 0.63 | 1.21 |
| PAH 17 μm Flux | 32 | <14 | 260.0 | <27 | <36 | <48 | 42 | <0.89 | 25 |
| PAH 17 Flux Error | ± 10 | ⋅⋅⋅ | ± 80 | ⋅⋅⋅ | ⋅⋅⋅ | ⋅⋅⋅ | ± 20 | ⋅⋅⋅ | ± 10 |
| PAH 17 Lum | 0.090 | <0.25 | 13 | <0.26 | <7.0 | <0.80 | 0.30 | <0.12 | 0.68 |
| H2 S1 Flux | 38.7 | 16.8 | <20 | 18.0 | <11 | 49 | 10.0 | 1.8 | 23.6 |
| H2 S1 Flux Error | ± 0.9 | ± 0.7 | ⋅⋅⋅ | ± 1.0 | ⋅⋅⋅ | ± 2 | ± 2 | ± 0.2 | ± 0.5 |
| H2 S1 Lum | 0.109 | 0.310 | <0.9 | 0.174 | <2.2 | 0.82 | 0.075 | 0.25 | 0.635 |
| H2 S2 Flux | 13.7 | 7.0 | 10.9 | 6.4 | 5.1 | 14.5 | 4.0 | 1.1 | 9.7 |
| H2 S2 Flux Error | ± 0.3 | ± 0.4 | ± 0.7 | ± 0.3 | ± 2.0 | ± 0.8 | ± 1.0 | ± 0.2 | ± 0.3 |
| H2 S2 Lum | 0.0386 | 0.13 | 0.56 | 0.062 | 0.99 | 0.242 | 0.029 | 0.15 | 0.26 |
| H2 S3 Flux | 40.8 | 27.8 | 28 | 22 | 9.6 | 56 | 11 | 3.73 | 27.0 |
| H2 S3 Flux Error | ± 0.4 | ± 0.5 | ± 1 | ± 2 | ± 0.6 | ± 1 | ± 1 | ± 0.09 | ± 0.3 |
| H2 S3 Lum | 0.115 | 0.511 | 1.4 | 0.21 | 1.9 | 0.93 | 0.077 | 0.509 | 0.726 |
| Cont 24 μm Flux (mJy) | 2.66 | 0.931 | 91.0 | 2.12 | 25.4 | 2.57 | 9.0 | <0.04 | 11.6 |
| Cont 24 Flux Error | ± 0.06 | ± 0.05 | ± 0.1 | ± 0.07 | ± 0.1 | ± 0.1 | ± 0.06 | ⋅⋅⋅ | ± 0.03 |
| Cont 24 Lum | 0.937 | 2.14 | 582.0 | 2.56 | 614.0 | 5.35 | 8.1 | <0.7 | 38.9 |
| Cont 15 μm Flux (mJy) | 1.45 | 0.520 | 28.4 | 1.04 | 6.13 | 1.07 | 4.49 | <0.1 | 3.13 |
| Cont 15 Flux Error | ± 0.1 | ± 0.1 | ± 0.2 | ± 0.1 | ± 0.3 | ± 0.3 | ± 0.2 | ⋅⋅⋅ | ± 0.06 |
| Cont 15 Lum | 0.817 | 1.91 | 291.0 | 2.01 | 237.0 | 3.57 | 6.43 | <2.73 | 16.8 |
| Cont 6 μm Flux (mJy) | 2.60 | 1.14 | 2.23 | 1.46 | 0.99 | 1.0 | 2.20 | 0.36 | 1.18 |
| Cont 6 Flux Error | ± 0.03 | ± 0.05 | ± 0.05 | ± 0.04 | ± 0.09 | ± 0.1 | ± 0.05 | ± 0.02 | ± 0.05 |
| Cont 6 Lum | 3.66 | 10.5 | 57.1 | 7.04 | 96.0 | 8.4 | 7.8 | 25.0 | 15.9 |
Notes. Emission-line flux values are in rest-frame units of 10−18 W m−2, while continuum ("Cont") fluxes are quoted in mJy. Luminosities are in units of 1042 erg s−1. Fluxes, luminosities, and wavelengths are corrected to their rest-frame values (To recover the observed flux, multiply by (1 + z).) The 1σ flux errors are statistical only. A 15% systematic error (0.06 dex) is included in the plots and in the analysis, as discussed in Section 2.3. Upper limits are 3σ. aThe fit to 2A0335's 7.7 μm PAH complex failed because of decreased signal near the expected location of the feature. We were unable to set an upper limit in this case.
Download table as: ASCIITypeset image
For analysis and plots, we combine the uncertainty calculated by the Spitzer Science Center pipeline in quadrature with a 15% systematic uncertainty to all fluxes to account for the uncertainty in scaling the IRS photometry relative to Spitzer broadband photometry. The systematic uncertainty dominates in almost all measurements. An additional 5% absolute photometric uncertainty is applied when making comparisons with data from other telescopes.10
2.4. PAHFIT Spectral Decomposition
We used the spectral-decomposition package PAHFIT v1.2 (Smith et al. 2007b) to make empirical fits to the IRS spectra and to facilitate direct comparison with results from other workers using the same method. The short-wavelength PAHFIT results are plotted in Figure 1 and the full-wavelength results are shown in Figure 2. PAHFIT fits the following components: a starlight continuum, several thermal dust continuum components, broad PAH emission bands, narrow atomic and molecular emission lines, and broad silicate absorption bands (Figure 1). We customized the list of fitted emission features to a limited set, excluding those that were very weak. In the case of 2A0335, small parts of the spectrum (below 5.3 μm and between 7.05 and 7.35 μm) were excluded from the PAHFIT analysis because noise in those parts of the spectrum hindered a successful fit.

Figure 2. PAHFIT results over the full-wavelength coverage. The continuum (stellar + thermal dust) is represented by a thick gray line, and the full spectral extraction by a green line. The rest-frame flux intensities are plotted with statistical uncertainties. Note the log scaling exaggerates the uncertainty of the faint, long-wavelength continua for several targets. Appropriately transformed IRAC and MIPS photometry points are indicated by cyan squares (see Table 5).
Download figure:
Standard image High-resolution image3. RESULTS
Our BCG galaxies exhibit a number of emission features from PAHs, ions, and H2 molecules. The H2 features are unusually prominent. The BCG spectra qualitatively fall into two general categories. Four galaxies (A1835, A1068, PKS0745, and Hydra A) exhibit the strongly rising IR continuum at >25 μm and distinct PAH features characteristic of galaxies with strong signatures of star formation (e.g., Brandl et al. 2006; Smith et al. 2007b). In the remaining five cases, the 5–7 μm continuum is dominated by cool stars, in contrast to the spectra of starbursts.
Several spectral features, which do not correspond to a known emission feature, are artifacts of noise or the data reduction process. For example, in the spectrum of A1835, there is noise on the red shoulder of the 11.3 μm PAH band where the SL and LL modules do not perfectly align; this is also responsible for noise near 13 μm in A478. The junction between the LL2 and LL1 accounts for some of the noise near 17 μm for A1835 and near 20 μm for 2A0335. A feature near 24 μm in the spectrum of A1068 may be attributed to [Ne v]24.3 μm, as discussed in Section 5.5, but is probably spurious. An emission feature near 4.9 μm in A478, and possibly A1795, A2597, and PKS0745, might be ascribed to [Ar v]4.93 μm or to an unidentified PAH. The feature at 20.7 μm in A478 is unidentified. The noise at 15.0 μm in the spectra of A2597 and A1795, and 18.0 μm in Hydra A, appears to be spurious. Note that noise increases dramatically past about 33 μm in the observed frame.
The features we will examine most closely in this paper are the relatively bright forbidden emission lines of [Ne ii] at 12.8 μm, [Ne iii] at 15.6 μm, and the PAH complexes at 7.7, 11.3, and 17 μm. We include an analysis of the correlation of the intensities of the brightest rotationally excited molecular hydrogen transitions, S(2) and S(3), with those of other spectral features. A selection of line measurements and intrinsic luminosities including 1σ statistical errors from PAHFIT are presented in Table 5. The continuum fluxes and luminosities (νLν) are found from the feature-free continuum (the stellar blackbody, thermal dust components, and silicate absorption). The continuum measurements were determined by averaging across bandpasses 1 μm in width at 6 and 15 μm, and weighting by the 24 μm MIPS response. All fluxes and luminosities in Table 5 are presented in the rest frame, at the rest wavelength. To recover observed fluxes, multiply by (1 + z). A more detailed analysis of the molecular hydrogen line ratios and excitation diagrams is deferred to a paper in preparation.
4. BEST-FIT STARBURST AND OLD STELLAR POPULATION SED MODELS
We fit the IRS spectra of the BCGs with an ensemble of simulated SEDs. These models allow us to estimate the total infrared luminosity and associated SFRs and to identify differences between the SED of a star-forming galaxy and the observed SEDs. We use the suite of starburst models, including a wavelength-dependent attenuation template, described in Groves et al. (2008) together with an SED of a 10 billion year old stellar population, derived using Starburst99 (Leitherer et al. 1999). Groves et al. (2008) model the starburst SED as the time-integrated sum of distinct H ii regions and the photodissociation regions (PDRs) surrounding them, over a range of cluster ages and cluster masses. These models were used to reproduce the SEDs of typical template starbursts such as Arp 220 and NGC 6240. The models span five different metallicities (Z = 0.05, 0.2, 0.4, 1.0, and 2.0 solar). Metallicity affects the prominence of the PAH features and the dust-to-gas ratio. The models sample six compactness parameters which characterize the intensity of the stellar radiation at the H ii region/PDR interface. More compact H ii regions result in hotter grains. determines the location (the "temperature") of the dust peak and thus controls the mid-IR emission peak, a feature that is not well constrained by IRS spectral coverage.


Groves et al. (2008) provide models for five gas pressures (P/k = 104, 105, 106, 107, and108 K cm−3), spanning the range of lower pressures in star-forming galaxies to the higher pressures in ULIRGs. However, the infrared SED between 5 and 25 μm is insensitive to the pressure except, at a marginal level, the forbidden lines, and we checked that changing the gas pressure does not change the other parameters. Since the ICM pressure in cool-core clusters is ∼106–107 K cm−3, the fits reported in Table 7 sample the range of 106, 107, and108 K cm−3. Finally, the Groves et al. (2008) models were computed for unobscured H ii regions and H ii regions with PDRs. We opted here to fit only the PDR models, since the models with only H ii regions had no PAHs. Models are normalized in luminosity to an SFR of 1 M☉ yr−1 sustained over the 10 Myr lifetime of the H ii region. The spectra and the best-fit components are shown in Figure 3.

Download figure:
Standard image High-resolution image
Figure 3. Rest wavelength 5–35 μm spectra, observed fluxes. (To convert to rest-frame flux, divide by (1+z).) Red line: best-fit constant star formation model from Groves et al. (2008). Blue line: best-fit old stellar population. Green line: molecular hydrogen, two-temperature LTE model.
Download figure:
Standard image High-resolution imageWe compared the observed spectra with the full suite of theoretical spectra and quantitatively identified the spectrum that best fit the data, in Lν units, by minimizing the sum of chi-squared. In addition to the quantized parameters described above, we fit the normalization for each starburst SED (M☉ yr−1), the attenuation (AV), and the normalization of the old stellar SED (M☉). The Groves et al. (2008) models include forbidden lines and PAH emission, but not molecular emission, so we added a two-component local thermodynamic equilibrium (LTE) H2 spectrum, each component specified by T (K), and column density N (1018 cm−2). We used molecular properties and A-values from Black & Dalgarno (1976) and Huber & Herzberg (1979). The widths of the H2 lines were fixed to 0.05 μm.
In this comparison, the compactness parameter () seemed to divide BCGs with strong rising IR continuum from those with relatively flat IR continuum in the IRS spectral range. The fit quality was sensitive to , which mainly affects the steepness of the long-wavelength IR continuum. The BCGs with the best fit are 2A0335, A1795, A2597, A478, and MS0735. The first four of these galaxies have the lowest four 24/70 μm MIPS photometry ratios in the sample (=0.03 ± 0.01); MS0735 lacks MIPS photometry. The signal to noise in the IRS spectrum of MS0735 at long-wavelengths is so low that there are no strong preferences for any starburst SED over another. The other four BCGs in the sample have higher 24/70 μm ratios (=0.08 ± 0.02). This trend in flux ratios is consistent with the compactness parameter governing the peak in the dust spectrum, in the sense that more compact H ii regions have PDRs with hotter dust.


The metallicity also affects the SED in this region, particularly the relative strength of the PAH feature to the infrared continuum. The preferred starburst SED metallicities for the BCGs were at the high end (Z/Z☉ = 1 or 2). For all of the BCGs, the fit quality was very similar for Z/Z☉ = 1 or 2, except for that of A1068, which preferred Z/Z☉ = 0.5 or 1. That result is consistent with the fact that the BCG in A1068 has the lowest PAH to mid-IR continuum ratio of the sample (see Section 5.1). We note that these high metallicities are consistent with the metallicity of the ICM in the centers of these clusters. As expected, pressure did not affect the fit quality in any significant way. The spectral features, including the 7.7 and 11.3 μm PAH features, were often well matched by models including the PDRs at rest wavelengths shortward of 10–11 μm. The two-temperature molecular hydrogen template matched the H2 spectrum very well in most cases.
To check this process, we estimated the total infrared luminosity from the expression LTIR = 1.559 L24 + 2.1156 L70, adapted from Dale & Helou (2002). L24 is νLν at 24 μm and L70 is νLν at 70 μm. To adapt their Equation (4) to this expression, we assume that νLν at 70 μm ∼νLν at 160 μm. Some assumption was necessary since the 160 μm flux is only available for four objects. This approximation may underestimate the TIR luminosity by about 30% compared to estimates using the 160 μm luminosities, but these 160 μm luminosity estimates are subject to large systematic uncertainties, and the detected sources may not be representative of the sources lacking photometry. (For MS0735+74, we have no MIPS photometry and only a 3σ flux limit at 24 μm from the IRS spectrum. We do not include this source in plots of TIR.) We compared LTIR estimated from this adaptation of Dale & Helou (2002) to LTIR derived using the calibration of L24 in Equation (2) of Wu et al. (2010). To get rest-frame 70/24 μm ratios used in this calibration, we convert the observed MIPS luminosity 70–24 μm ratios to rest-frame ratios for eight of the nine galaxies in the sample with k-correction factors (k70/24) based on the best-fit SEDs (<3%–25%; Table 6). The derived total IR luminosities were consistent to better than 20% (Table 6). The relationship between either estimate of LTIR and the SED-inferred SFR is consistent with the Kennicutt (1998) SFR relation for starbursts (Figure 4(a)). This consistency indicates the 24 and 70 μm MIPS data, not included in the fits, are consistent with the SFRs inferred from the IRS data alone.

Figure 4. Comparison of infrared brightest cluster galaxy (BCG) star formation rates (SFRs) from the best-fit starburst models of Groves et al. (2008) and total infrared luminosity (LTIR) and the SFRs inferred from LTIR. On the left, we show these inferred SFRs are highly correlated with the total infrared luminosity (LTIR DH; Table 6). For comparison, the solid line shows the Kennicutt (1998) relation for starbursts (SFR(M☉ yr−1) = 0.045(LTIR/1042)erg s−1), along with ±30% typical calibration scatter (dotted lines). On the right, the same SFRs are plotted against the SFRs based on 70 μm luminosities, using the mean relation in Calzetti et al. (2010) (SFR(M☉) = 0.059(L70/1042)erg s−1). The solid line shows the line of equality; the dotted line shows how the predicted SFR from L70 would change, from Calzetti et al. (2010), if a different Hα-based SFR from Kennicutt (1998) is used for calibration.
Download figure:
Standard image High-resolution imageTable 6. Total Infrared Luminosity Estimates
| Name | L24 | LTIR (DH) | LTIR (W) | k70/24 | log L70/L24 |
|---|---|---|---|---|---|
| (1042 erg s−1) | (1042 erg s−1) | (1042 erg s−1) | (rest) | ||
| 2A0335 | 0.94 | 21.2 | 25.8 | 0.97 | 1.07 |
| A478 | 2.14 | 108.0 | 76.2 | 0.92 | 1.09 |
| A1068 | 582.0 | 5060.0 | 4120 | 0.73 | 0.48 |
| A1795 | 2.56 | 36.6 | 40.9 | 0.94 | 0.82 |
| A1835 | 614.0 | 4028.0 | 4210.0 | 0.83 | 0.45 |
| A2597 | 5.35 | 143.0 | 177.0 | 0.92 | 1.13 |
| HydraA | 7.32 | 112.0 | 94.3 | 0.94 | 0.74 |
| PKS0745 | 38.9 | 437.0 | 389.0 | 0.84 | 0.64 |
Notes. All luminosities are in units 1042 erg s−1. L24 is rest-frame νLν at 24 μm from the IRS spectra. LTIR (DH) is the TIR derived from a relation adapted from Dale & Helou (2002). LTIR (W) is based on L24 and the observed ratio L70/L24 luminosities based on MIPS photometry, from Equation (2) in Wu et al. (2010). The k-correction for the 70/24 μm luminosity ratio is based on rest- and observer-frame MIPS response functions convolved with the best-fit SED shapes. The last column is the log10 ratio of the k-corrected, rest-frame L70/L24 luminosities.
Download table as: ASCIITypeset image
In Figure 4(b), we plot the SFRs based on the SED fits versus the Calzetti et al. (2010) mean relation for SFRs derived from the observed MIPS 70 μm luminosities (νLν) (SFR(M☉) = 0.059(L70/1042)erg s−1). The dotted line shows the same relation, also from Calzetti et al. (2010), if a different Hα-based SFR from Kennicutt (1998) is used for calibration. Figure 4 demonstrates reasonable consistency between SFRs estimated based on SED fits to the IRS spectra and SFRs derived from MIPS photometry. One caveat to this comparison is that the IR continuum of galaxies with a significant old stellar population may have contributions from dust heated by these cool stars. The observed 70 μm luminosities of the BCGs are somewhat higher than what is predicted by the best-fit SEDs, by a factor of 1.3–2.4, which, if taken literally, may indicate that dust heated by evolved stars may be contributing between 30% and 60% of the 70 μm luminosity. The 70 μm luminosities of these BCGs are in the valid domain for applying the relationships in Calzetti et al. (2010); the 160 μm luminosities are likely to be even more contaminated from cool dust emission unrelated to star formation.
It is interesting to note that the SFR estimates based on 24 μm luminosities, from Calzetti et al. (2010), are systematically lower compared to SFRs based on these SED fits or the 70 μm luminosities for the four galaxies with high 70/24 μm flux ratios (A478, 2A0335, A2597, and A1795) and low best-fit , as well as MS0735 (which has no MIPS photometry). In Figure 5, we plot the rest-frame 70/24 μm luminosity ratio of the BCGs together with the local sample studied by Calzetti et al. (2010, Figure 17). The rest-frame 24 μm luminosity is calculated from the IRS spectra, but it is consistent with MIPS photometry. The rest-frame ratios are based on MIPS photometry alone, with small k-corrections (<10% for z < 0.1, and 10%–25% for z > 0.1), based on the best-fit starburst SEDs. The 70/24 μm ratio varies by about a factor of 10 for a given 24 μm luminosity in the full sample of Calzetti galaxies, and some of this scatter is due to metallicity, with the highest metallicity systems having the highest 70/24 μm luminosity ratios. The 70/24 μm ratios of BCGs are similar to, but somewhat higher than, those of high-metallicity star-forming galaxies. The two BCGs most like starbursts, A1835 and A1068, have ratios similar to the LIRGs of the Calzetti et al. (2010) sample.

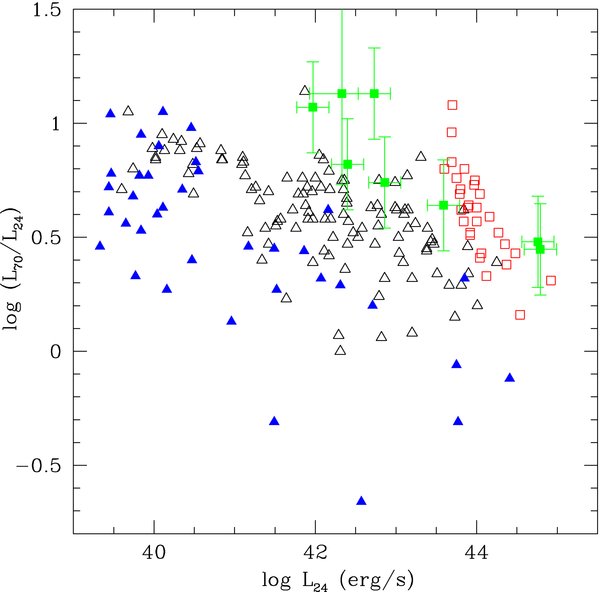
Figure 5. L70/L24 ratio as a function of the 24 μm luminosity L24. The open black triangles are higher-metallicity star-forming galaxies; the closed blue triangles are lower-metallicity star-forming galaxies; and the open red squares are luminous infrared galaxies (LIRGs), all from Calzetti et al. (2010). The green symbols with error bars are the rest-frame 24 μm luminosities and rest-frame (k-corrected) 70–24 μm luminosity ratios for the eight BCGs in our sample with MIPS photometry.
Download figure:
Standard image High-resolution imageWe briefly discuss the results of the comparison to theoretical SEDs of star-forming galaxies for each source, ordered approximately by decreasing mid-IR luminosity. Note that all fluxes and luminosities in this paper are derived from PAHFIT, not these fits.
A1835. The IRS spectrum of A1835 shows a strong red continuum and PAH features whose shapes and intensities are well fit by the model in Table 7. The most prominent residual is the overestimate of the flux of the [S iii] 18.7 μm line.
Table 7. Best-fit Starburst PDR + H ii Model Parameters and Stellar Masses
| Name | Z/Z☉ | log P/k | H ii | AV | Old Star | SFR | T1 | N1 (H2) | T2 | N2 (H2) | |
|---|---|---|---|---|---|---|---|---|---|---|---|
| (K cm−3) | or PDR | (mag) | (1011 M☉) | (M☉ yr−1) | (K) | (1018 cm−2) | (K) | (1018 cm−2) | |||
| 2A0335 | 1 | 4 | 8 | PDR | 0 | 1.5 | 0.7 | 350 (5) | 52 (0.2) | 1200 (30) | 0.8 (0.1) |
| A478 | 2 | 4 | 8 | PDR | 0 | 4.4 | 2.7 | 460 (10) | 13 (0.7) | 1920 (200) | 0.12 (0.02) |
| A1068 | 1 | 6.5 | 8 | PDR | 2.5 | 8.6 | 100 | 320 (4) | 98 (7) | 2000a | 0.120 (0.007) |
| A1795 | 2 | 4 | 8 | PDR | 0 | 2.6 | 2.3 | 260 (13) | 48 (0.6) | 760 (40) | 1.7 (0.2) |
| A1835 | 2 | 5.5 | 6 | PDR | 0 | 26 | 270 | 530 (40) | 4.7 (1.5) | 1300 (750) | 0.03 (0.02) |
| A2597 | 2 | 4 | 8 | PDR | 0 | 4.1 | 5.4 | 240 (4) | 160 (8) | 810 (17) | 4.9 (0.3) |
| HydraA | 2 | 5 | 7 | PDR | 0 | 3.3 | 4.3 | 380 (25) | 15 (0.3) | ⋅⋅⋅ | ⋅⋅⋅ |
| MS0735 | 2 | 4 | 6 | PDR | 0 | 9.7 | 0.3 (0.12) | 300 (240) | 4.4 (7) | 730 (70) | 0.5 (0.2) |
| PKS0745 | 2 | 6.0 | 8 | PDR | 0 | 5 | 11 | 390 (20) | 26 (1) | 1200 (65) | 0.48 (0.05) |

Notes. aValue pegged at extreme temperature. Uncertainties are quoted in parentheses. Component normalizations for the old stellar population SED and the starburst SED had statistical uncertainties of less than 1%–3%, with the exception of MS0735. However, the photometric calibration and scaling uncertainties were ∼15%–20%, so at minimum, uncertainties at that level apply to the stellar masses and SFRs estimated here.
Download table as: ASCIITypeset image
A1068. The IRS spectrum of A1068 is similar to that of A1835 in that it has a strong red continuum, but its emission features are weaker. All features are well matched except for a 24 μm feature that is likely spurious but could be associated with [Ne v]24.3 μm. (The deficiency in the model spectrum between 13 and 18 μm is a shortcoming of the Groves et al. (2008) models compared to many starburst spectra.)
PKS0745-19. The IRS spectrum of PKS0745-19 also has a strong red continuum but fainter PAHs than A1835. The observed long-wavelength slope is flatter than the model. The observed blend of [Fe ii] + [O iv] at 26 μm is bright. For this source, the [Ne ii]12.8 μm and [Ne iii]15.6 μm features are underpredicted by our simulated SED. The H2 S(1) transition is quite bright.
Hydra A. The fit to the IRS spectrum of Hydra A overpredicts the [S iii] 33 μm line somewhat, while the [S iii] 18.7 μm line is underpredicted. The ratio of this line pair is set by gas density. Shortward of 20 μm, the spectrum resembles the best-fit starburst model fairly well, except for the previously noted deficiency in the model spectra between 10 and 19 μm. As in other systems, the [Fe ii] + [O iv] blend is not modeled.
A2597. The IRS spectrum of A2597 is fairly flat. Most features seem to be represented. There are small excesses of [Ne ii] and [Ne iii] emission visible in the residuals.
A1795. The IRS spectrum of A1795 is fairly well represented by the starburst models.
A478. The IRS spectrum of A478 is faint. The data exhibit stronger lines of [Ne ii] and [Ne iii] and a flatter long-wave spectral slope.
2A0335+096. The IRS spectrum of 2A0335+096 has a flat red continuum, and molecular hydrogen and neon lines are well fit by the model. The most prominent feature in the residual spectrum is the strong [Si ii] 34.8 μm line. 2A0335 is the lowest redshift source, so we have no other sources for context, and it does sit near the edge of the spectrum where noise spikes are not uncommon. The [Ne iii]/[Ne ii] ratio is higher than predicted in the best-fit model.
MS0735+74. The IRS spectrum of MS0735+74 has a flat red continuum with very weak emission-line features, and to the limits of the data, fit but not tightly constrained in this exercise.
In summary, the starburst models of time-averaged H ii regions and PDRs, based on fits to the IRS data, do a surprisingly good job at qualitatively representing the continuum, PAH, and nebular features of the IRS spectra of BCGs, but far from perfectly. On the other hand, the SFRs derived are consistent with estimates based on the 70 μm continuum or PAH features. We will discuss this further in Section 5.3, where we show that the H2 and [Ne ii] luminosities are significantly higher than those of star-forming galaxies with similar infrared luminosities. While the PAHs and the IR continuum are usually well represented, the models do not match the nebular [Ne ii] (and [Ne iii]) emission relative to the continuum, and the slope of the continuum through the longest wavelengths of the IRS spectra is not consistently fit for spectra with faint IR continua. We note that the metric for a best fit for a given starburst model is dominated by the continuum since most of the points are continuum.
5. DISCUSSION
In typical star-forming galaxies, the luminosities of dust, PAHs, [Ne ii] lines, and even the rotationally excited molecular hydrogen lines are linearly correlated with each other and with the SFR. There is a significant uncertainty in the SFR inferred for any individual galaxy, a factor of 5–10, because of the dispersion, but these quantities are highly correlated in star-forming galaxies. Therefore, we compare the correlations we see for the BCGs in our sample with those of star-forming galaxies. We will show here, based on the correlations and ratios that we observe for BCGs, that the infrared continuum and PAH features are consistent with being powered primarily by star formation in BCGs. In contrast, the emission lines from rotational transitions of hydrogen are uncorrelated with the dust and PAH features and are primarily powered by a second process. The forbidden lines of neon are correlated with the IR emission, but not linearly. This pattern is consistent with these lines being powered by star formation and a second process that does not provide much heat to the PAHs and dust but is very effective at producing H2 emission. This second heating mechanism is consistent with heating by a population of suprathermal electrons (Ferland et al. 2008, 2009), either from the hot gas or perhaps associated with the radio source.
All linear correlation coefficients (r) in the analysis below are based on the measurements in logarithmic quantities unless stated otherwise. For reference, a correlation of r > 0.66(r > 0.86) might be considered significant at the 2σ (3σ) level for N = 9 points (e.g., Bevington 1969). In general, if two quantities are correlated linearly (i.e., the log–log slope is unity), they may have common origins. But if they are correlated, but not linearly, there may be something more interesting going on. For that reason, we plot dotted lines with unity slope in our correlation graphs.
5.1. Dust and PAH Luminosity Correlations
The smallest dust grains are the PAHs, composed of only a hundred atoms or so. These structures generate emission from C–H or C–C–C bending modes (Leger & Puget 1984; Boulanger et al. 1998; Van Kerckhoven et al. 2000), excited by the absorption of UV photons (Allamandola et al. 1985; Sloan et al. 1999). UV photons can heat these tiny grains stochastically, causing them to suddenly increase in temperature then cool (e.g., Li & Draine 2001). PAH features at 3.3, 6.2, 7.7, 8.6, and 11.3 μm in spectra are thought to be an excellent tracer of B stars or of relatively recent star formation (Peeters et al. 2004; Brandl et al. 2006; Förster Schreiber et al. 2004). The continuum IR luminosity, which traces star formation, and PAH luminosity are strongly correlated in normal star-forming galaxies (Wu et al. 2010). Studies of low-metallicity star-forming dwarf galaxies by Rosenberg et al. (2008) and of star-forming regions in irregular galaxies by Hunter & Kaufman (2007) show the PAH emission decreases as metallicity decreases, so metallicity is one factor that can lead to scatter in the correlation between PAH emission and IR luminosity from dust.
The brightest features from the PAHs are the complexes at 11.3 μm and 7.7 μm. The sum of those lines in our BCG sample is strongly correlated with the 24 μm continuum in both flux and luminosity (Figure 6). The correlation coefficient r = 0.93 for both. Excluding MS0735 does not affect the correlation. The relationship is very close to linear: L11.3 + 7.7∝L0.90 ± 0.0324, where L24 = νLν at 24 μm rest frame. (L11.3∝L0.96 ± 0.05TIR.)

Figure 6. PAH and infrared continuum properties compared. The 24 μm continuum luminosity (L24) is strongly correlated with the sum of the luminosities of the PAH complexes at 11.3 μm and 7.7 μm. The slope of the best-fit power law (plotted as a solid line) is 0.90 ± 0.03. For comparison, a dotted line of slope unity is shown. On the right, we show that the ratio of PAH (11.3 μm) to LTIR (W; Table 6) is ∼0.0039 ± 0.0020. The solid line is the mean ∼0.0066+0.0045 − 0.0042 from Wu et al. (2010); the dashed line is the lower limit of the range of their best fit to the mean for starburst galaxies. Given the uncertainties in converting from L70 and L24 to LTIR, this plot shows that these galaxies have PAH/IR-luminosity ratios that are only somewhat lower than normal star-forming galaxies, with the exception of A1068 and A2597.
Download figure:
Standard image High-resolution imageThe ratio of the 11.3 μm luminosity to LTIR is ∼0.0039 ± 0.0020 (omitting MS0735 from the sample for lack of MIPS data), plotted in Figure 6(b), to compare to the mean of ∼0.0066+0.0045 − 0.0042L0.02 ± 0.0311.3 μm from 123 starburst-dominated galaxies from a 24 μm flux-limited sample of 330 galaxies in Wu et al. (2010). The best-fit power law relating L11.3 μm and LαTIR is α = 1.05 ± 0.05, also similar to that seen for starburst galaxies (Wu et al. 2010). Given the uncertainties in converting from L70 and L24 to LTIR, this comparison shows that these galaxies have PAH/IR-luminosity ratios that are only somewhat lower than normal star-forming galaxies, with the exception of A1068 and possibly A2597. The PAHs in A1835 are about four times brighter compared to L24 than the nearly equally IR luminous A1068, so we detect significant intrinsic scatter in this ratio. There is no correlation in the ratio of PAH/IR luminosities to IR luminosity (see Figure 6(b)).
The 11.3 μm PAH luminosity is highly correlated with the 24 μm and the TIR luminosity, which makes sense if the dust and PAHs are heated by the same process. The 15 and 24 μm continuum luminosities are strongly correlated with each other (r = 0.96) and nearly linearly correlated (L24∝L1.042 ± 0.00615), as expected since both quantities are usually produced by dust grains.
In contrast, 24 μm continuum and 11.3 μm PAH luminosities are not correlated with 6 μm continuum luminosity. In fact, when MS0735 is excluded, there is no correlation between 24 μm and 6 μm luminosities, r = 0.17. Similarly excluding MS0735, there is no correlation between the 6 μm and PAH flux at 11.3 μm (r = 0.23) or [Ne ii] (r = 0.004). (Including MS0735 in the tests increases the correlations to ∼0.6, under the 2σ threshold, but because the computed significance relies on the inclusion of a single source, it must be considered spurious.) The 6 μm light in these BCGs is produced primarily by old (cool) stars and therefore is a metric for the stellar mass. The lack of correlation between dust and stellar continua luminosities suggests that dust, PAH, and gas heating is not determined by cool stars. The systems where the dust luminosity well exceeds the 6 μm luminosity from stars, A1068 and A1835, exhibit higher PAH 7.7–11.3 μm ratios, consistent with the hypothesis that these are like starburst galaxies with levels of PAH ionization similar to those seen in starbursts (Figure 7). We will consider these ratios more fully in Section 5.4.

Figure 7. Plot of the PAH 7.7–11.3 μm ratio vs. the ratio of the 24/6 μm continuum luminosities. The PAH ratio indicates the ionization level of PAHs, and this ratio is higher in systems in which the 24 μm luminosity from dust exceeds the 6 μm stellar continuum. This trend is consistent with the PAHs in the BCG systems most like starbursts experiencing a harder incident radiation spectrum.
Download figure:
Standard image High-resolution imageFor the rest of this discussion, we will assume that the long-wavelength IR continuum is powered primarily by obscured recent star formation. However, even though dust heating by evolved stars does not seem to dominate these systems at 24–70 μm, evolved stars may be the dominant source of heat for cooler dust emitting at longer wavelengths, and this dust therefore could contribute to emission at shorter wavelengths (see Section 4). Furthermore, processes of interest such as suprathermal electron heating and weak AGN may also supply energy to these systems. Since the observed global quantities are galaxy-wide averages, they suffer from the same interpretation ambiguity as high redshift, unresolved sources. Even if we could interpret these spectra in the context of star formation alone, it is impossible to unambiguously distinguish between a star formation episode of a single age and stellar mass and a time-averaged star formation history of "constant" star formation. Physically, signatures of star formation in normal galaxies include cold, dusty molecular gas, excess UV continuum, Hα, PAH emission, and infrared dust emission. We will discuss these data in a framework where obscured star formation is tracked by the infrared and PAH emission. However, we will show that star formation alone is inadequate to explain the full set of infrared spectral features in these systems.
5.2. Forbidden Neon Line Correlations
The luminosities of forbidden lines of neon, which are channels for radiative cooling, are sensitive to the thermal energy input into the ionized gas. They therefore have also been shown to be good tracers of SFRs in normal star-forming galaxies. Ho & Keto (2007) showed that the sum of the fine structure lines of Ne ii (12.8 μm) and Ne iii (15.6 μm) correlates strongly with IR luminosity in normal star-forming galaxies over five orders of magnitude in luminosity. The sums of [Ne ii] and [Ne iii] luminosities in our BCG sample also correlate strongly with L24 (r = 0.95, fluxes correlate with r = 0.90). [Ne ii] alone is just as correlated (r = 0.94, fluxes correlate with r = 0.91). The relationship, however, deviates even more from linearity than the PAH–IR-luminosity relationship, with scaling as L0.58 ± 0.0324 (or L0.79 ± 0.04TIR). We suspect that while the dust and the PAHs are heated primarily by star formation, this lack of linearity in the [Ne ii]-IR correlation suggests that star formation may not be the sole process producing [Ne ii] emission.
![$L([{\rm Ne\,{\mathsc{ii}}}])$](https://content.cld.iop.org/journals/0004-637X/732/1/40/revision1/apj386498ieqn8.gif)
The ratio of [Ne ii] to total infrared luminosity (LTIR (W); Table 6) decreases somewhat with increasing IR luminosity (Figure 8). The Ho & Keto (2007) mean relationship between [Ne ii] and LTIR for star-forming galaxies is , nearly independent of LTIR. Excluding MS0735, the [Ne ii] luminosity in BCGs is about 1.6–12 times higher than the mean [Ne ii] luminosities of normal star-forming galaxies of similar infrared luminosities. The largest differences are found for the BCGs with lower IR luminosities (<1010 L☉). MS0735+74, for which there is only an upper limit continuum estimate, is particularly bright in [Ne ii] compared to its infrared luminosity (≳ 0.009), >25 × the mean. The observed scatter of this ratio for normal star-forming galaxies in Ho & Keto (2007) is large, ±0.5 dex; nevertheless, the BCG ratios sit consistently on the high side of the scatter for normal star-forming galaxies, indicating that another process beyond star formation is also contributing to the heating of the ionized gas, particularly in the low-luminosity systems. In summary, the [Ne ii] luminosities seen in the low IR–luminosity BCGs exceed what would be expected from a star-forming galaxy with the same IR luminosity, but the two quantities are strongly correlated.
![$\log ({\rm [{\rm Ne\,{\mathsc{ii}}}]/L_{\rm TIR}}) = {-3.44 \pm 0.56}$](https://content.cld.iop.org/journals/0004-637X/732/1/40/revision1/apj386498ieqn9.gif)

Figure 8. [Ne ii] and infrared continuum properties compared. On the left, [Ne ii] luminosity is strongly correlated with L24 luminosity, but the best-fit power-law (solid) is flatter than linear, with a index of 0.59 ± 0.03. A dotted line with slope unity is plotted for comparison. On the right, the ratio of [Ne ii] luminosity to LTIR (LTIR (W); Table 6) continuum luminosity decreases with increasing LTIR. The ratio for typical star-forming galaxies, , from Ho & Keto (2007) is plotted. The dotted line is the approximate upper bound of the intrinsic scatter.
![$\log ({\rm [{\rm Ne\,{\mathsc{ii}}}]/L_{\rm TIR}}) = {-3.44 \pm 0.56}$](https://content.cld.iop.org/journals/0004-637X/732/1/40/revision1/apj386498ieqn10.gif)
Download figure:
Standard image High-resolution imageThe [Ne iii]/[Ne ii] ratio is not at all correlated with the mid-IR luminosity (Figure 9). It is possible that the [Ne iii]/[Ne ii] ratio indicates an approximate starburst age, with BCGs having the highest [Ne iii]/[Ne ii] also having the youngest starburst populations, but not necessarily the largest numbers of young stars (Thornley et al. 2000; Rigby & Rieke 2004; Snijders et al. 2007).

Figure 9. [Ne iii]/[Ne ii] ratios, indicators of the hardness of the incident UV spectrum for the ionized gas, are plotted against the 24 μm luminosity, a surrogate for star formation rate. The ionization level of the gas shows no correlation with the mid-IR continuum. The neon line ratios exhibit intrinsic scatter, possibly evidence that either the ages of the youngest stars vary from system to system (which would mean a constant star formation rate is not a good assumption) or the mix of heating mechanisms (between star formation and energetic particles) differs from galaxy to galaxy.
Download figure:
Standard image High-resolution image5.3. Molecular Hydrogen Correlations
Extremely luminous pure rotational H2 lines, usually S(3) 9.67 μm, S(2) 12.28 μm, and S(1) 17.04 μm, are detected in all nine galaxies. S(0) 28.22 μm was not detected in any of these sources. Rotational transitions from S(5) to S(7) (5.51 μm) are seen in a majority of these spectra. While the luminosities of rotationally excited molecular hydrogen lines are correlated with IR luminosities of star-forming galaxies (Treyer et al. 2010) that is certainly not the case with our BCG sample. The line luminosities from rotational molecular hydrogen transitions from these BCGs are much greater than expected from the level of star formation heating the warm dust. H2 emission is also uncorrelated with the continuum at 15 or 24 μm, r = 0.4–0.5.
Rotational emission from molecular hydrogen is commonly detected in ULIRGs (Higdon et al. 2006) and in star-forming normal galaxies (Roussel et al. 2007). In such galaxies, the luminosities of these lines are only about 4 × 10⁻⁴ of the total infrared power between 8 and 1000 μm. However, the ratio of H2 luminosity to L24 for the BCGs in this sample, ranging from 0.004 to 0.3, is about 5–100 times more than one would expect from a PDR. The most extreme object is MS0735, owing to its faint (and uncertain) IR continuum. The large H2 luminosity from off-nuclear regions in the BCG NGC 1275 (Johnstone et al. 2007) led Ferland et al. (2008, 2009) to propose that much of the H2 luminosity in BCGs located in X-ray cool-core clusters can be generated by cosmic ray heating or by non-radiative processes such as plasma waves.
BCGs are not the only galaxies to exhibit unusually large luminosities of rotational molecular hydrogen. Ogle et al. (2007) find the FR II radio galaxies have strong H2 lines, but these galaxies are dissimilar to the BCGs in our sample. For example, 3C 326 exhibits high-ionization [Ne v] and [O iv] emission, indicating AGNs or LINER-like lines, very tiny SFRs (<0.1 M☉ yr−1), and the H2 line transitions are primarily S(0) and S(1), indicative of cooler molecular gas than in our sample. These transitions are also seen in IRS mapping of the nearby group of galaxies, Stephan's Quintet, which exhibits bright H2 (Cluver et al. 2010). Similarly, H2 S(0) and S(1) emission lines have been reported from IRS mapping of edge-on spiral galaxies (Laine et al. 2010). An archival study of ULIRGs by Zakamska (2010) suggests that their H2 emission is not associated with star formation. While many of these studies speculate that shocks might be a source of energy (e.g., Ogle et al. 2010) and might be quite common, the unifying thread to all of their discussions is that the molecular hydrogen rotational lines are surprisingly bright and their source of energy is still unidentified. The situation is not much different here, except the BCGs tend to also exhibit rotational lines characteristic of warmer molecular gas than the groups or radio galaxies (S(2), S(3), and S(7)).
The mid-IR luminosity is not significantly correlated with the summed luminosity of the molecular hydrogen lines, here represented by the sum of S(2) and S(3) lines, which were reliably detected in all nine systems (Figure 10(a)). While we showed in Section 5.2 that [Ne ii] emission is correlated with dust continuum emission, here we see that dust continuum is not significantly correlated with molecular hydrogen emission (for fluxes, r = 0.5; for luminosities r = 0.68). We plot the ratio of H2 sum to mid-IR luminosity (Figure 10(b)). These ratios decrease for the systems with the highest mid-IR luminosities. This trend appears because the H2 luminosities are limited in range (factor of 20) while the IR luminosity spans a large range (>1000). We interpret the trend to mean that the H2 heat source is more important and in fact dominates the IR emission features in systems with low mid-IR luminosities.

Figure 10. Rotational H2 and infrared continuum properties compared. On left, the summed luminosity of the two most prominent rotational hydrogen lines (S(2), S(3)) is very weakly correlated (<2σ significance) with the L24 as might be expected if the sample is (approximately) flux limited; if plotted as a flux–flux diagram, all correlation disappears. A dotted line of slope unity is shown. On the right, the ratio of molecular hydrogen to L24 decreases with increasing L24, which suggests that the source of energy powering H2 is unrelated to star formation in most of this sample. At the highest IR luminosities (A1068 and A1835), the H2 might be generated by star formation processes.
Download figure:
Standard image High-resolution imageThe rather insignificant correlation between H2 and L24 utterly vanishes once MS0735 is omitted from the sample. A similar effect happens when [Ne ii] flux is compared with H2 flux: dropping MS0735 from the sample causes a very weak (less than 2σ) correlation to completely vanish. On the other hand, the luminosity of [Ne ii] is correlated with the luminosity of the H2 S(2) + S(3) lines (r = 0.92). The presence or absence of MS0735 has little effect on the inferred strong correlations between Ne ii, PAHs, and mid-IR continuum flux and luminosity correlations. This correlation analysis suggests that while there is some relationship between the heat sources for the ionized gas and the dust, there appears to be a much weaker relationship between the heating sources for the molecular hydrogen and the dust. The ratio of molecular hydrogen to IR luminosity (Figure 10(b)) decreases with increasing IR luminosity, however, and suggests that the H2 heating process becomes less important to the total luminosity budget as star formation increases.
The strong luminosity correlation between [Ne ii] and H2 required further investigation, since the lack of correlations in the flux quantities suggested the luminosity correlation may be a simple "bigger is bigger" luminosity–luminosity comparison. (See Kennicutt 1990 for an infamous description of this type of error, involving a cigar.) Intriguingly, we find that the ratio of [Ne ii] to L24 correlates even more strongly with the ratio of H2 S(2)+S(3) summed luminosity to L24 (r = 0.98). The best power-law fit to this relationship is H2/IR ∼ ([Ne ii]/IR)1.49 ± 0.12 (Figure 11). The correlation of these ratios suggests that whatever process heats the molecular hydrogen is likely to be the culprit that boosts the forbidden line luminosity (heating the ionized gas) as well.
Figure 11. [Ne ii]/IR ratio correlates with H2/IR, which might be expected if the heating source that powers the molecular hydrogen well over that expected from star formation also elevates the [Ne ii] emissivity of the ionized gas over that expected from star formation. This additional heating source might simultaneously explain the H2 luminosity and the excess [Ne ii] luminosity. The dashed line indicates a slope of unity.
Download figure:
Standard image High-resolution imageTo explore this idea further, we investigated how much more luminous the neon and molecular hydrogen lines are than one would expect from a star-forming galaxy, if the dust luminosity were a reliable indicator of the level of star formation. In Figure 12, we estimated the SFRs inferred from the IR continuum (the best fits to the Groves et al. 2008 models, which are consistent with Kennicutt 1998 estimates), from the [Ne ii]+[Ne iii] luminosity (Ho & Keto 2007), and from the H2 luminosity (Treyer et al. 2010). For the latter estimate, we assumed that the Ne+/Ne = 0.75 and Ne++/Ne = 0.15. The H2-based SFR in Treyer et al. (2010) relies on the sum of the S(0), S(1), and S(2) transitions, which were not all detected in our systems. The sums plotted are based only on luminosities of the detected lines. These plots show that for most of the BCGs, while [Ne ii] is moderately overluminous for the inferred IR-based SFR (a factor of 2–5 above the upper end of the scatter exhibited by the galaxy sample of Ho & Keto (2007), and a factor of ∼10 over the mean), the H2 luminosity is a factor of 5–15 overluminous based on the IR-based SFRs. The BCGs in A1068, A1835, and Hydra A have ratios typical of starbursts.

Figure 12. Ratios of inferred star formation rates demonstrate that both the forbidden neon lines and the molecular rotational lines are being emitted in excess of what would be expected of a star-forming galaxy where the star formation rate is tracked by the IR luminosity. The left plot shows the ratio of the star formation rates from the sum of [Ne ii]+[Ne iii] (Ho & Keto 2007) compared to our estimated IR star formation rates, based on fits to the infrared continuum. The lower line shows the average of the Ho & Keto rate compared to the IR rate based on Kennicutt (1998) quantities for their sample. The higher line shows the upper limit of their scatter. Therefore [Ne ii] in BCGs is moderately overluminous, by a factor of ∼3 over the mean for star-forming galaxies. The rotational transitions in H2 are overluminous by a factor of 5–15. In both these relations, MS0735 is an extreme example.
Download figure:
Standard image High-resolution imageIt is interesting that the best fit for the points in Figure 11 is nearly linear. The slightly steeper than linear fit might be explained in the context of heating by suprathermal particles if the luminosity of the ionized gas ([Ne ii]) is limited by the finite column density of ionized gas, while the luminosity of the rotational line emission from the molecular gas is limited by the penetration depth of the suprathermal particles into the molecular gas, not the total column density of molecular hydrogen.
We defer a full discussion of the excitation analysis of the individual molecular hydrogen lines to a future paper. The more approximate dual temperature fit that we have done here, however, shows very similar trends to those seen in NGC 1275 filaments: the H2 rotational line intensities cannot be fit by a single temperature. This trend is consistent with any model with a non-radiative energy source (Ferland et al. 2008).
In summary, as we examined correlations of continuum, PAH, and emission lines of [Ne ii] and H2, and compared them to correlations and infrared line ratios in other types of galaxies, it emerged that a single heating process cannot explain the range of infrared properties we see in these BCGs. Star formation seems to play a role, albeit with varying levels of dominance, in producing the emission from these systems, but other processes unrelated to star formation must also contribute, particularly in systems with apparently low rates of star formation but high fluxes from rotationally excited transitions of molecular hydrogen.
5.4. PAHs and Dust Grain Survival and Processing
If the dust in these BCGs spent much time in contact with the hot, X-ray emitting gas (or more generally, suprathermal electrons), one might expect the dust properties, such as its size distribution or ionization fraction, to be different from dust that has not undergone such a traumatic experience. PAH survival alone is problematic if suprathermal particles alone provide heat: radiation and collisions make PAH lifetimes in the harsh environment of the center of a cool-core cluster of galaxies quite short. Using order of magnitude cross sections from Voit (1992a), and 0.5 keV photon fluxes of about 106 cm−2 s−1, we estimate lifetimes of order one million years. The damage from particle collisions may be even more dire. From the analysis of Micelotta et al. (2010), the lifetime of PAH molecules embedded in ∼1 keV gas with a density of ∼0.1 cm−3 is limited to hundreds of years by collisions with the hot electrons and ions. Any processing along these lines causes the PAHs and small grains to evaporate preferentially compared to large grains. The presence of PAHs requires the dusty gas to be shielded from the hot gas and its radiation.
As in other galaxies observed with the Spitzer IRS (Smith et al. 2007b; Kaneda et al. 2008), the fluxes and luminosities of the PAH complex at 7.7 μm and at 11.3 μm are strongly and linearly correlated. The 7.7 and 11.3 μm PAH complex luminosities are strongly correlated (r = 0.98, fluxes at r = 0.94) for all seven systems in which both are detected. 2A0335 and MS0735 lack PAH 7.7 μm detections.
The ratio of 7.7–11.3 μm PAH complexes is relatively insensitive to the sizes of the PAHs (Schutte et al. 1993), but sensitive to the ratio of ionized to neutral PAHs (Allamandola et al. 1989; Draine & Li 2007). For example, the ratio of the PAH complex at 7.7 to the PAH complex at 11.3 μm is lower in galaxy centers that are AGN-dominated compared with those which are H ii dominated (Smith et al. 2007b). The mean range for seven ratios of the PAH complexes at 7.7 and 11.3 μm in our sample is 2.7 ± 0.2 (Figure 13). The mean sample ratio is intermediate between that of H ii/starburst galaxies (4.2; Smith et al. 2007b) and diffuse Galactic emission (2–3.3; Sakon et al. 2004). The BCGs with classic indicators of starburst activity (A1068 and A1835) have ratios typical of starbursts; the others are closer to that of Galactic interstellar medium (ISM). In elliptical galaxies, the PAH 7.7/11.3 ratio is unusually weak (∼1–2; Kaneda et al. 2008); the lowest ratios seen in dusty ellipticals are lower than the ratios detected in our BCG sample. For BCGs with a low PAH 7.7 μm to 11.3 μm ratio, the incident spectrum on the PAHs may be dominated by evolved stars, compared to a harder, ionizing spectrum with contributions from young massive stars. Our result suggests that the radiation fields in BCGs are intermediate in their hardness between those of dusty elliptical galaxies and star-forming galaxies, which is consistent with what one might expect in the ISM of galaxies with enormous old stellar populations, together with small numbers of recently formed stars.

Figure 13. PAH complex at 7.7 μm is strongly correlated with the PAH complex at 11.3 μm. The mean ratio for starbursts, indicated with a single horizontal line at the top of the plot, is ∼4. Diffuse Galactic ISM generates ratios from 2to3.3, shaded pink (light gray), and the ratio in dusty ellipticals ranges from 1to2, shaded blue (darker gray). The weighted mean for seven BCGs with PAH 7.7 μm detections in our sample is 2.7 ± 0.2, indicating radiation fields intermediate in hardness between dusty elliptical and normal star-forming galaxies.
Download figure:
Standard image High-resolution imageThe ratio of PAH complexes at 17 and 11.3 μm is thought to be regulated by PAH sizes with large PAHs contributing more to the longer wavelength complex (e.g., Draine & Li 2007). The broad PAH feature at 17 μm was detected with confidence in four BCGs (2A0335, A1068, Hydra A, and PKS0745), while the others have 3σ upper limits (Figure 14). With the single exception of A1068, the detections and upper limits are consistent with the ratio of PAH 17 μm to PAH 11.3 μm fluxes typical of normal star-forming galaxies (∼0.5; Smith et al. 2007b). The consistency of the observed ratios and limits in nearly all of these BCGs compared with those with normal galaxies suggests that the PAH size distribution may be normal. The exception of A1068, with a ratio >2, indicates that it may have deficit of small PAHs compared to large PAHs. This BCG also has a smaller PAH to LTIR ratio. In the BCG of A1068, PAHs, and particularly the small PAHs, may have been preferentially destroyed by collisions with particles or photons.

Figure 14. Luminosity ratios and upper limits for the PAH complexes at 17 and 11.3 μm. The line indicates the mean value of the ratio between the 17 and 11.3 μm PAH complexes (0.5) for normal star-forming galaxies (Smith et al. 2007b). Only A1068 has a ratio that is distinctly atypical, suggesting some processing of the smaller PAHs have occurred in that system.
Download figure:
Standard image High-resolution imageSince both [Ne iii]/[Ne ii] and the ratio of PAH 7.7 μm to 11.3 μm flux are related to the hardness of radiation, we compared these quantities to see whether they are correlated (Figure 15) and whether the BCG points cover similar parameter space as other galaxies. We see no correlation between the PAH ratios and the neon forbidden line ratios, but that is not surprising since the gas producing the forbidden lines is different from the gas hosting the PAHs; similarly, the photons ionizing neon are not the same photons setting the ionization level of PAHs. As shown in Figure 15, the seven BCGs with detections in all four quantities exhibit ratios rather similar to SINGS galaxies (Smith et al. 2007b). There are spiral galaxies in the SINGS sample in Figure 15 with very high [Ne iii]/[Ne ii] ratios (>10); the explanation may be that these galaxies (about 15% of the SINGS sample) are dominated by very recent star formation, and therefore hotter O stars (Thornley et al. 2000; Rigby & Rieke 2004; Snijders et al. 2007), compared to the BCGs. LINERs in the Smith et al. (2007b) sample do not exhibit [Ne iii]/[Ne ii] <0.7–0.8 together with low PAH 7.7/11.3 μm fractions (<2), so a few of the BCGs in our sample with low [Ne iii]/[Ne ii] ratios (A1795, A478, and PKS0745) also have lower PAH 7.7/11.3 μm ratios than seen in the SINGS sample, more similar to those of dusty ellipticals (Kaneda et al. 2008) or diffuse Galactic ISM (Sakon et al. 2004). The two systems with the highest IR and PAH luminosities of the sample (A1068 and A1835) also exhibit the largest PAH 7.7/11.3 μm ratios, indicating that the PAHs in the most luminous BCG systems are more ionized than those in the other BCGs.

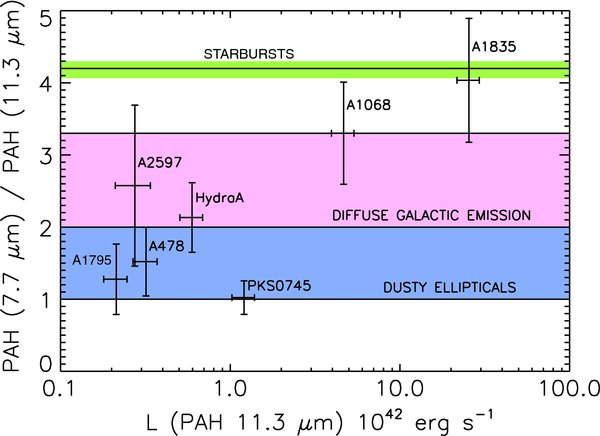
Figure 15. [Ne iii]/[Ne ii] and PAH 7.7 μm and 11.3 μm ratios for 55 SINGS galaxies (Smith et al. 2007b; using online data from their Table 4) with black points, elliptical galaxies (Kaneda et al. 2008) with blue filled circles inside triangles, and our sample (red, filled square points). The [Ne iii]/[Ne ii] line ratios of BCGs are similar to those seen in star-forming galaxies with low [Ne iii]/[Ne ii] ratios, LINERS, and dusty ellipticals. Three of the red (filled square) points (A478, A1795, and PKS0745) have somewhat lower PAH 7.7–11.3 μm ratios than seen in SINGS galaxies with similarly low [Ne iii]/[Ne ii] ratios, but are rather similar to the ratios seen in ellipticals in Kaneda et al. (2008). 2A0335 and MS0735 are not plotted here.
Download figure:
Standard image High-resolution image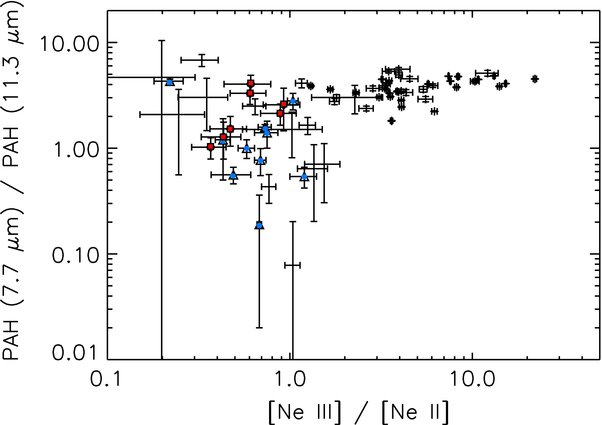
We arrive at the following conclusions about the PAHs and dust in these systems.
- 1.The presence of PAHs, and the similarity of the PAH emission ratios to those in star-forming galaxies, means that these tiny grains must be protected from the ICM and shocks. PAHs are easily destroyed by ionizing UV and X-rays, by collisions with hot thermal particles, and by shocks.
- 2.The emissivities of the PAHs and the ionized gas are correlated with the mid-IR continuum emitted by dust grains. Therefore, there is a common source of heat for these components, consistent with being star formation. However, the excess luminosity of [Ne ii] and H2 in the less luminous systems suggests that another component is contributing to the heating of the ionized gas in addition to star formation.
- 3.The emissivity of the PAHs is not correlated with the stellar (6 μm) IR continuum. Correlation is expected if the stars were the main agent heating the dust.
We speculate that the evolved stars in the BCGs are the main production source of dust. The dust, except in a couple of cases, shows little indication that it may have been processed by hot, X-ray emitting plasma, or the AGN. The source of the cool BCG gas may be the hot ICM, but it seems unlikely that the dust came with the gas. Dust, however, is an extremely effective coolant, and if mixed with the hot gas, could precipitate the cooling necessary to fuel the formation of dusty molecular star-forming clouds.
5.5. AGN Contributions
Synchrotron radiation from a jet could contribute some of the infrared continuum. Cleary et al. (2007) find in their survey of an unbiased set of 3CR and quasars that only the quasars have a nonthermal contribution at 15 μm of >20%. About half of the 15 μm emission from nucleus of M87 is synchrotron emission, based on analysis of its IRS spectrum (Buson et al. 2009). Of the nine sources in our sample, only Hydra A has a radio synchrotron source that is luminous enough to contribute more than ∼10% to the IRS continuum at 24 μm, if its power law extends unbroken into the infrared.
High-ionization lines in the infrared could indicate a buried AGN or the presence of very hot stars. [Ne v] 14.3 μm and 24.3 μm, with an ionization potential of 97.1 eV, would be an unambiguous AGN indicator (Voit 1992b). We did not detect this emission line in any of our sources at a level ≳ 10−17 W m−2), although a weak [Ne v]14.3 μm feature is detected in A1835 and Hydra A, and a suspicious (possibly spurious) feature appears near 24 μm in the spectrum of A1068, which is known to have some AGN contribution in the infrared (Quillen et al. 2008). The lack of [Ne v] does not rule out some AGN contribution, since this line can be faint compared to [Ne ii]. [O iv] at 25.9 μm would also be an unambiguous sign of AGN photoionization, since O iii has an ionization potential just above that of He i (to He ii), 54.4 eV, and is therefore rare in regions ionized by stars. However, [O iv] 25.9 μm is blended with [Fe ii] at 26 μm. We detected this blend unambiguously only in PKS0745-19 and Hydra A. Puzzlingly (if this blend is an indication of the presence of O iv), the [Ne iii]/[Ne ii] ratio in PKS0745-19 is one of the lowest in the sample. The [O iv]–[Fe ii] blend does not appear at all in the spectrum of A1068, however, nor does [Ne v] 14.3 μm. The lack of these features casts further doubt on the candidate [Ne v] feature in that spectrum.
The presence of high-ionization lines such as [S iv] (10.51 μm) and [Ne iii] indicates the presence of young hot stars in these galaxies. The ionization parameters consistent with the [Ne iii]/[Ne ii] ratios in the ionized gas are similar to those seen in star-forming galaxies. The energy required to ionize neon once to Ne ii is 21.6 eV, compared to 41 eV for reaching Ne iii. [Ne ii] was easily detected in every galaxy in our sample, and only MS0735+74 lacked detectable [Ne iii]. Although S iii to S iv has an ionization potential (34.8 eV) similar to Ne ii to Ne iii, it has a very low photoionization cross section. So a significant detection of [S iv] not only indicates hot stars, but also a high density of them. In contrast to [Ne iii], [S iv] was not detected in any of the systems. PAHFIT results for 2A0335+096, A1835, A1068, and Hydra A indicate faint formal detections at ∼3σ–7σ, but inspection of the fits and data causes us to regard these detections as extremely marginal.
Based on the lack of [Ne v] emission lines from the gas, we have no conclusive evidence in favor of the gas being photoionized by an AGN, consistent with conclusions based on spatially resolved optical emission-line studies of these and similar galaxies (e.g., Heckman et al. 1989).
The detection of spatially extended UV continuum in a number of cases is unambiguous evidence of the importance of recent star formation over AGN contributions in this sample of BCGs (McNamara & O'Connell 1993; Martel et al. 2002; O'Dea et al. 2004; Hicks & Mushotzky 2005; Hicks et al. 2010; Donahue et al. 2010). Since lack of evidence is not the same as evidence of lack, we keep in mind that some of the spectra may have contributions from a low-luminosity AGN since none of these spectra exclude the nucleus. However, Occam's Razor prefers the simplest explanation for heating these systems, and as such, no need for AGN excitation or heating is required by these observations.
6. CONCLUSIONS
In our Spitzer IRS spectroscopic study of nine BCGs residing in cool-core X-ray clusters, we have detected very bright molecular hydrogen rotational transitions, PAH features, and forbidden lines from ionized gas (Ne ii, Ne iii), in addition to dust continuum at 15–25 μm. These galaxies were known previously to have prominent optical forbidden and Balmer emission-line nebulae (e.g., Heckman et al. 1989). Photometric MIPS and IRAC studies of similar BCGs have shown prominent mid-infrared dust emission, together with UV and blue signatures of star formation (e.g., O'Dea et al. 2008). The low-resolution Spitzer 5–25 μm IRS spectra reveal that BCGs host PAHs, and the ratios of these features indicate that the PAHs in such BCGs are similar to PAHs in other types of galaxies. The emission from PAHs and dust are highly correlated, nearly linearly, as might be expected if the PAHs and dust are heated by star formation. The ratios of the 11.3 μm PAH luminosities to total IR luminosities are similar to or slightly lower than those of normal star-forming galaxies, with the exception of MS0735 whose PAH 11.3 μm feature is well detected, and its IR continuum is very weak. Fits of simulated starburst models published in Groves et al. (2008) show that the SFRs inferred from the 5–25 μm spectra are consistent with SFRs inferred from our 70 μm MIPS photometry using relations from Kennicutt (1998) and Calzetti et al. (2010). These simulated starburst SEDs also provide reasonable fits to the PAH features in the spectra, again consistent with the strong, nearly linear correlation between PAH luminosity and dust continuum luminosities.
The luminosity of the warm ionized gas, traced by the [Ne ii]12.6 μm emission line, is also correlated with the dust luminosity, so it is likely that the star formation powering the dust luminosity is also contributing to the heating of the warm ISM. However, the relation is distinctly nonlinear, in the sense that the systems with lower IR luminosities have larger [Ne ii]/IR ratios. All of the systems are overluminous in [Ne ii] compared with PAH or dust emission, as most lie at or above the top end of the scatter of this luminosity relation as seen in star-forming galaxies (Smith et al. 2007b).
Even more strikingly, the molecular hydrogen luminosities of BCGs are very high compared to that expected from star-forming galaxies of similar infrared luminosities. The H2 luminosities are only weakly correlated with the mid-IR or PAH luminosities, suggesting that the H2 emission-line power source is nearly independent of that powering the dust. The strong correlation of the molecular hydrogen line luminosity scaled by L24 with [Ne ii] scaled in the same way suggests that the warm gas has a second heat source that may be related to the primary power source for the molecular hydrogen emission lines, a scenario consistent with excess heating by energetic particles and/or conduction from the hot intracluster gas (Sparks et al. 1989; Ferland et al. 2008, 2009).
The existence of dusty gas and, in particular, PAHs, along with the fact that PAH feature ratios are similar to those found in star-forming galaxies, suggests that (1) the dust and PAHs are similar in ionization and size distributions as in spiral galaxies and that (2) the PAHs and dust are shielded from the destructive X-ray radiation and fast-moving thermal particles in the ICM. On the other hand, the ionized and molecular gas may indeed receive a noticeable energy dose from thermal particles from the hot ICM, boosting the forbidden line radiation from the ionized gas and the rotational line emission from molecular hydrogen.
The fits with starburst SEDs from Groves et al. (2008) give a consistent story to our empirical comparisons: we can simultaneously fit the mid-IR continuum and PAH features and some of the ISM emission lines, and the fits give SFRs which are consistent with Kennicutt's (1998) relations for the 24–70 μm photometry measured with Spitzer MIPS and with Calzetti et al. (2010) relations for 70 μm. However, the models do not reliably predict the neon line spectrum, which we suggest may be partially generated by the same physical mechanism that generates the majority of the molecular H 2 emission.
Furthermore, our results are in agreement with the Johnstone et al. (2007) analysis of IRS spectra of NGC 1275 and NGC 4696. Our sample further demonstrates that there is no correlation between the star-formation signatures in these galaxies and the strength of the molecular hydrogen luminosities and that molecular hydrogen luminosities are more extreme than produced by typical star formation-related processes. The neon forbidden lines and rotational lines of molecular hydrogen can be enhanced without significantly modifying the luminosities of dust if the ionized gas and some of the molecular gas is heated by non-radiative agents that can penetrate the molecular gas clouds, such as cosmic rays, hot electrons, and MHD waves.
The authors are grateful for tabulated plot data from Daniela Calzetti and for discussions with Brent Groves and Michael Dopita. We acknowledge the referee for a careful review of our manuscript. M.D., G.M.V., and A.H. acknowledge support from a Jet Propulsion Lab contract JPL 1353923 and a NASA LTSA grant NASA NNG-05GD82G. G.M.V. acknowledges partial support from NSF grant AST-0908819. M.D. thanks the Aspen Center of Physics where she began this work in the summer of 2008, and the Kavli Institute of Theoretical Physics in Santa Barbara, CA, where she finished the paper in 2011 February. This research was supported in part by the National Science Foundation under grant NSF PHY05-51164. This work is based on observations made with the Spitzer Space Telescope, which is operated by the Jet Propulsion Laboratory, California Institute of Technology under a contract with NASA. Support for G.D.M., B.R.M., and R.W.O. was provided by NASA through two awards issued by JPL/Caltech.
Facilities: Spitzer (IRS, MIPS, IRAC) - Spitzer Space Telescope satellite
Footnotes
- 7
- 8
- 9
- 10