


ABSTRACT
Mergers in the local universe present a unique opportunity for studying the transformations of galaxies in detail. Presented here are recent results, based on multi-wavelength, high-resolution imaging and medium resolution spectroscopy, which demonstrate how star formation and the presence of red supergiants and/or asymptotic giant branch stars have led to a serious underestimation of the dynamical masses of infrared-bright galaxies. The dominance of a nuclear disk of young stars in the near-infrared bands, where dust obscuration does not block their signatures, can severely bias the global properties measured in a galaxy, including mass. This explains why past studies of gas-rich luminous infrared galaxies (LIRGs) and ultraluminous infrared galaxies, which have measured dynamical masses using the 1.62 or 2.29 μm CO band heads, have found that these galaxies are forming m < m* ellipticals. On the other hand, precisely because of dust obscuration, I-band photometry and velocity dispersions obtained with the calcium II triplet at 0.85 μm reflect the global properties of the mergers and suggest that all types of merger remnants, including infrared-bright ones, will form m > m* ellipticals. Moreover, merger remnants, including LIRGs, are placed on the I-band fundamental plane for the first time and appear to be virtually indistinguishable from elliptical galaxies.
Export citation and abstract BibTeX RIS
1. INTRODUCTION
A fundamental, controversial, and still unanswered question is whether gas-rich spiral–spiral mergers (Toomre & Toomre 1972; Toomre 1977) can populate the entire mass range of elliptical galaxies. The Toomore Hypothesis posits that such mergers can form elliptical galaxies, often with a final stellar mass larger than the sum of its progenitors. This theory has moved from initial skepticism and dismissal, to an integral role in the currently accepted paradigm of ΛCDM cosmology. In the local universe, luminous and ultraluminous infrared galaxies (LIRGs/ULIRGs) are ideal candidates for forming massive elliptical galaxies (Kormendy & Sanders 1992). These are objects with 8–1000 μm infrared luminosities (LIR) > 1011 L☉ (Sanders & Mirabel 1996), and have been known for over two decades to contain vast quantities of molecular gas (e.g., Casoli et al. 1988, 1991; Sargent et al. 1989; Wang et al. 1991; Solomon et al. 1992, 1997; Scoville et al. 1997; Bryant & Scoville 1996, 1999; Downes & Solomon 1998; Iono et al. 2005). Nearly all ULIRGs and most LIRGs show evidence of recent or ongoing merging activity (i.e., double nuclei, tidal tails). The star formation rates (SFRs) of these objects are quite high (e.g., Prestwich et al. 1994), for example, radio recombination line observations of the nearest ULIRG, Arp 220, imply a formation rate of 103 M☉ yr−1 (Anantharamaiah et al. 2000), while CO interferometric data indicate that 0.15–0.46 of the dynamical mass (Mdyn) of this system is gaseous (Downes & Solomon 1998; Greve et al. 2009). Taken together, the SFRs and vast quantities of gas have the potential to add a significant stellar component to the total mass of the merger.
In recent years, however, skepticism has re-emerged not only about the ability of gas-rich mergers to form a significant fraction of the elliptical galaxy population, but about whether they are capable of even forming m* elliptical galaxies (m* ∼ 3 × 10¹⁰ M☉; Bell et al. 2003). LIRGs/ULIRGs have been the focus of a number of photometric and kinematic studies, sometimes with seemingly contradictory results. Until recently, kinematic studies of LIRGs/ULIRGs have relied solely on measuring the central velocity dispersions σ○ with the near-IR CO stellar absorption lines at 1.6 μm and 2.29 μm (hereafter denoted as σ○,CO). These stellar lines are prominent in red, evolved stars, and are well situated within observable atmospheric windows in the near-IR. Use of near-IR stellar absorption lines to obtain stellar kinematics and infer galaxy masses was initially motivated by the need to penetrate areas of high dust extinction (i.e., the Galactic Center and M82) and later applied to dusty LIRGs/ULIRGs.
Shier & Fischer (1998) observed a small sample of LIRGs and found that the distribution of stellar σ○,CO was consistent with moderate luminosity elliptical galaxies (L ∼ 0.03–0.15 L*). James et al. (1999) found a different result for a sample of merger remnants which included non-LIRGs, LIRGs, and ULIRGs, namely that σ○,CO spanned a wider range of values. However, statistically they could not discern whether the σ○,CO of mergers were consistent with ellipticals or the bulges of spiral galaxies. In a larger study of ULIRGs Genzel et al. (2001), Tacconi et al. (2002), and Dasyra et al. (2006) found that these galaxies have H-band σ○,CO distributions consistent with m ⩽ m* ellipticals.
These studies also compared LIRGs/ULIRGs with the "fundamental plane" (FP) of elliptical galaxies, a two-dimensional plane embedded within the three-dimensional parameter space comprised of σ○, the effective, or half-light radius (Reff), and the surface brightness within the effective radius (〈μ〉eff). In principle, the FP can be derived from the Virial Theorem. It is well known that early-type galaxies and bulges obey a tight correlation among these three parameters (Djorgovski & Davis 1987), but late-type galaxies do not. The LIRGs/ULIRGs were found to lie somewhat offset from the FP, with high 〈μ〉eff and low σ○. The studies concluded that the 〈μ〉eff offsets were due to the presence of a starburst, and that once the star formation ceased, the LIRGs/ULIRGs would evolve onto the FP coincident with a region occupied by low-intermediate mass ellipticals.
Yet, work using optical σ○ and B-band photometry produced different results. Lake & Dressler (1986) measured σ○ using the Mg Ib (λ ∼ 0.51 μm) and Ca ii triplet (λ ∼ 0.85 μm), hereafter CaT, for a sample of 13 optically selected mergers, of which none were LIRGs/ULIRGs. They found no deviation from the Faber–Jackson relation (Faber & Jackson 1976), a two parameter correlation between L and σ○ obeyed by all early-type galaxies, similar to the FP, but with somewhat more observed scatter. Moreover, the merger remnants occupied the part of the Faber–Jackson relation dominated by bright, massive galaxies, even taking into account LB fading after a starburst. Similarly, Rothberg & Joseph (2006a, hereafter RJ06a), measured velocity dispersions using the CaT absorption lines (hereafter denoted as σ○,CaT) for 38 optically selected single-nuclei merger remnants, including 10 LIRGs. Combining σ○,CaT with K-band photometry, RJ06a found most of the merger remnants lay on the K-band FP (Pahre et al. 1998a, hereafter P98). However, a small group, dominated by LIRGs, did lie offset from the FP in a "tail"-like feature. While they concluded that the offset was due to a starburst which increased the brightness of 〈μK〉eff, they found that once these objects faded, their σ○,CaTs were large enough that they would evolve onto the FP in a region where m* or bigger ellipticals resided. This was a different result from the earlier near-IR studies, but most intriguingly, a different result for many of the same galaxies.
RJ06a found, upon further inspection, that σ○,CO was smaller than σ○,CaT by an average of 25% for the eight mergers (six LIRGs, and the non-LIRGs NGC 4194 and NGC 7252) common to their sample and the earlier IR studies. This appeared to be a counter-intuitive result. The original impetus to obtain σ○,CO for LIRGs (and ULIRGs) was to penetrate dust in order to measure the true Mdyn, yet this produced a smaller mass than optical observations. RJ06a suggested several possibilities to explain this "σ-discrepancy": (1) a fundamental problem in using either the CaT absorption lines or CO band heads to measure σ○, which would affect σ○ measurements in all galaxies; (2) the sensitivity of the K-band spectroscopy to a younger population of stars and insensitivity of the CaT spectroscopy to that same population; or (3) a central rotating stellar disk enshrouded by dust which effectively blocks the light at λ ⩽ 1 μm. The presence of a rotating disk of young stars and dust is compatible with observations of counter-rotating ionized gas, cold molecular gas, and Hubble Space Telescope (HST) resolved young stellar clusters found in the archetypal merger remnant NGC 7252 (Schweizer 1982; Dupraz et al. 1990; Wang et al. 1992; Whitmore et al. 1993) and with numerical simulations of gaseous dissipation in mergers (Barnes & Hernquist 1991, 1996; Barnes 2002). In the models, the gas is funneled into the barycenter of the merging system and forms a rotating gas disk. The gas disk undergoes a strong starburst, eventually forming a disk of young stars. The numerical simulations from Mihos & Hernquist (1994, hereafter MH94), Springel (2000), and Hopkins et al. (2008) show that the gaseous dissipation and central starburst should also produce a spike in luminosity at r ⩽ 1 kpc. This "excess light" was observed in the K-band light profiles of merger remnants by Rothberg & Joseph (2004, hereafter RJ04), and may be an observational signature of the presence of these star-forming disks.
The first hint that differences existed between optical σ○ and σ○,CO came from Silge & Gebhardt (2003, hereafter SG03). They compared σ○,optical (including Mg Ib and CaT) and σ○,CO in 25 nearby early-type galaxies and found a similar σ-discrepancy. The σ○,CO's were up to 30% smaller than σ○,optical's. Systematic errors from variations in continuum fitting and choice of template stars were tested and could account for no more than a 5% difference in σ○. The largest discrepancies were found to arise from early-type galaxies with disky components, in particular, lenticular or S0 types. SG03 attributed the discrepancy to the presence of dust. They argued that the cold disk component in S0s was enshrouded in dust, making it invisible to optical observations, but detectable in the near-IR, while the dynamically hot bulge dominated the optical observations. To date, a study of the discrepancy in "pure" elliptical galaxies has not been done.
More recently, Veilleux et al. (2009) found that dynamical black hole (BH) mass estimates from σCO via the MBH–σ relation were systematically smaller than BH mass estimates from other methods by a factor of ∼7 in ULIRGs, and a factor ∼3–4 in Palomar Green QSOs. The work showed that BH mass estimates from luminosity, reverberation mapping and virial measurements from Hβ profiles and the empirical relationship between broad-line region size and 0.51 μm luminosity all agreed with each other to within a factor of ∼3 or better without any systematic offsets. These results demonstrate an underestimation of mass from σCO relative to masses measured from methods unrelated to the CaT stellar lines.
The primary goal of the present work is to determine the cause of the σ-discrepancy and ascertain the true mass distribution of the merger remnant population. This goal is achieved by reanalyzing previous spectroscopic observations of the CaT absorption lines at 0.85 μm, analyzing new medium resolution spectroscopic observations of the CO band heads at 2.29 μm along with archival HST I-band photometry and previously published K-band photometry to derive kinematic and photometric properties. In addition, a control sample of elliptical galaxies with measurements taken mostly from the literature is included to further characterize the degree to which the σ-discrepancy occurs in non-merger galaxies and to help understand the effect. The data are used to (1) compare σ○ for both merger remnants and elliptical galaxies to test for systematic differences as indicated by earlier studies and to look for correlations that help elucidate their underlying causes; (2) place merger remnants and elliptical galaxies on the FP using σ○,CaT, σ○,CO, and I-band and K-band photometry, effectively comparing "pure" I-band and "pure" K-band FPs; and (3) investigate the properties of the central 1.53 h−1 kpc of the merger remnants.
All data and calculations in this paper assume H○ = 75 km s−1 Mpc−1 and a cosmology of ΩM = 0.3, Ωλ = 0.7 (q○ = −0.55). In this work, the delineation between non-LIRGs, LIRGs, and ULIRGs is strict at LIR < 1011L ☉, 1011L ☉ ⩽ LIR < 1011.99L ☉, and LIR > 1012L ☉, respectively. As a result, one merger remnant originally classified as a LIRG in RJ06a, NGC 4194, has been reclassified as a non-LIRG for this paper using the revised Infrared Astronomical Satellite (IRAS) fluxes in Sanders et al. (2003).
2. SAMPLES
2.1. Merger Sample
In this work, the kinematic and photometric properties of a sample of 14 merger remnants are compared with a comparison sample of 23 elliptical galaxies. Both σ○,CO and σ○,CaT have been measured for all galaxies in the merger remnant sample, and are either presented here for the first time, have been culled from the literature, or have been re-reduced for this work. The merger remnants studied here are a subsample of the 51 optically selected advanced (i.e., single nuclei) merger remnants from RJ04 (see that paper for details on the selection criteria and sources). The subsample presented here was compiled on the basis of completed observations and data available from the literature.
New near-IR spectroscopic observations centered on the 2.29 μm 12CO (2,0) band head are presented here for seven galaxies. These galaxies are all non-LIRGs that lie on or near the K-band FP based on CaT spectroscopic velocity dispersions (RJ06a). The original GNIRS program (GS-2007A-Q-17, P.I.: Rothberg) included a total of nine non-LIRG merger remnants and the E0 elliptical galaxy, NGC 5812, but only six merger remnants, and the E0 were observed due to the catastrophic failure of the instrument.
In addition to the six observed merger remnants, CO data for eight more merger remnants are included in this paper. Data for two of the eight added merger remnants (NGC 1614, NGC 2623) were previously published in RJ06a, but the data have been reanalyzed. The remaining six were culled from the literature (Oliva et al. 1995; James et al. 1999; Genzel et al. 2001; Hinz & Rieke 2006). Overall, six of the eight additional merger remnants are classified as LIRGs. There are no ULIRGs included in this study.
Table 1 lists the names, right ascension (R.A.), and declination (decl.) of the merger remnants. Since most of the objects have multiple designations, all subsequent references to sample galaxies within the paper, tables and figures will first use the NGC designation if available, followed by the Arp or Arp-Madore (AM), UGC, VV and lastly the IC designation if no other designation is available. Unless otherwise noted, the merger remnants are listed in order of R.A. in tables and figures.
Table 1. Galaxy Sample
| Galaxy Name | Other Names | R.A. | Decl. | Notes |
|---|---|---|---|---|
| (J2000) | (J2000) | |||
| Merger remnants | ||||
| NGC 1614a | Arp 186, IRAS 04315 − 0840, Mrk 617 | 04h33m59s | −08°34'44'' | R |
| AM 0612 − 373 | ESO 307−IG 025 | 06h13m47s | −37°40'37'' | R,N |
| NGC 2418 | Arp 165, UGC 3931 | 07h36m37s | 17°53'02'' | R,N |
| NGC 2623a | Arp 243, UGC 4509, VV 79, IRAS 08354+2555 | 08h38m24s | 25°45'17'' | R |
| NGC 2914 | Arp 137, UGC 5096 | 09h34m02s | 10°06'31'' | R,N |
| NGC 3256a | AM 1025 − 433, VV 65, IRAS 10257 − 4338, ESO 263−IG 038 | 10h27m51s | −43°54'14'' | R,L |
| NGC 4194 | Arp 160, UGC 7241, VV 261, IRAS 12116+5448 | 12h14m09s | 54°31'36'' | R,L |
| NGC 5018 | UGCA 335, IRAS 13103 − 1915, ESO 576-G 010 | 13h13m00s | −19°31'05'' | R,N |
| Arp 193a | UGC 8387, VV 821, IC 883, IRAS 13183+3424 | 13h20m35s | 34°08'22'' | R,L |
| AM 1419 − 263 | ESO 511−IG 035 | 14h22m06s | −26°51'27'' | R,N |
| AM 2038 − 382 | IRAS 20380 − 3822, ESO 341−IG 004 | 20h41m13s | −38°11'36'' | R,N |
| AM 2055 − 425a | IRAS 20551 − 4250, ESO 286−IG 019 | 20h58m26s | −42°39'00'' | R,L |
| NGC 7252 | Arp 226, AM 2217 − 245, IRAS 22179 − 2455, ESO 533−IG 015 | 22h20m44s | −24°40'41'' | R,L |
| IC 5298a | IRAS 23135+2516 | 23h16m00s | 25°33'24'' | R,L |
| Ellipticals | ||||
| NGC 221 | M32, UGC 452, Arp 168, IRAS 00399+4035 | 00h42m41s | 40°51'55'' | L |
| NGC 315 | UGC 597 | 00h57m48s | 30°21'09'' | L |
| NGC 821 | UGC 1631 | 02h08m21s | 10°59'42'' | L |
| NGC 1052 | IRAS 02386 − 0828 | 02h41m04s | −08°15'21'' | L |
| NGC 1316 | Arp 154,AM 0320 − 372, IRAS 03208 − 3723, ESO 357-G 022 | 03h22m01s | −37°12'30'' | L |
| NGC 1344 | AM 0326 − 311, ESO 418-G 005 | 03h28m19s | −31°04'05'' | L |
| NGC 1374 | AM 0333 − 352, ESO 358-G 023 | 03h35m16s | −35°13'35'' | L |
| NGC 1379 | ESO 358-G 027 | 03h36m09s | −35°26'28'' | L |
| NGC 1399 | ESO 358-G 045 | 03h38m29s | −35°27'03'' | L |
| NGC 1404 | ESO 358-G 046 | 03h38m51s | −35°35'40'' | L |
| NGC 1407 | ESO 548-G 067 | 03h40m11s | −18°34'49'' | L |
| NGC 1419 | AM 0338 − 374, ESO 301-G 023 | 03h40m42s | −37°30'39'' | L |
| NGC 1427 | ESO 358-G 052 | 03h42m19s | −35°23'34'' | L |
| NGC 2974 | UGCA 172, IRAS 09400 − 0328 | 09h42m33s | −03°41'57'' | L |
| NGC 3377 | UGC 5899 | 10h47m42s | 13°59'08'' | L |
| NGC 3379 | M105, UGC 5902 | 10h47m49s | 12°34'54'' | L |
| NGC 4365 | UGC 7488 | 12h24m28s | 07°19'03'' | L |
| NGC 4472 | M49, Arp 134, UGC 7629 | 12h29m46s | 08°00'02'' | L |
| NGC 4486 | M87, Arp 152, UGC 7654, IRAS 12282+1240 | 12h30m49s | 12°23'28'' | L |
| NGC 5128 | Arp 153, AM 1322 − 424, IRAS 13225 − 4245, ESO 270−IG 009 | 13h25m27s | −43°01'09'' | L |
| NGC 5812 | UGCA 398 | 15h00m55s | −07°27'26'' | R,N |
| NGC 7619 | UGC 12523 | 23h20m14s | 08°12'23'' | L |
| NGC 7626 | UGC 12531 | 23h20m42s | 08°13'01'' | L |
Notes. aLIRG; R: reanalyzed data from RJ06a, N: new observations, L: data from the literature.
Download table as: ASCIITypeset image
2.2. Comparison Sample of Elliptical Galaxies
In order to test whether observed differences in CaT and CO derived σ○'s occur only in merger remnants, a comparison sample of elliptical galaxies has been assembled from the literature. The sample of 25 early-type galaxies (7 Es and 18 S0s) studied by SG03 was drawn from Tonry et al. (2001). SG03 concluded S0s were primarily responsible for the σ differences. To properly test the effect in ellipticals the literature has been thoroughly searched to include as many elliptical galaxies with σ○ measured using both optical (either Mg Ib or CaT) and 2.29 μm CO stellar lines. The comparison sample presented here includes 23 elliptical galaxies and are listed in Table 1, including names, R.A., decl. Since some objects have multiple names, they are noted in the same manner as the merger remnants. One elliptical, NGC 5812 was previously observed along with the sample of merger remnants using the same instrument setups and analyzed in the same manner as the merger remnants.
3. OBSERVATIONS AND DATA REDUCTION
3.1. Spectroscopy
3.1.1. Optical Spectroscopy
The optical spectra presented here are reanalyzed from the work presented in RJ06a. Briefly, the observations were obtained with the Echellete Spectrograph and Imager (ESI; Sheinis et al. 2002) at the W.M. Keck II 10 m observatory. A 0 5 slit width was used, with a slit length (spatial axis) of 20''. ESI has a fixed resolution of 36.2 km s−1 or R ∼ 8300. The position angle (P.A.) of the slit was rotated to correspond to the major axis of each galaxy as determined from K-band images. The data were reduced using the Image Reduction and Analysis Facility (IRAF)2 developed by the National Optical Astronomy Observatories. The reduction of the data and spectral extraction method used for both the central 1.53 h−1 kpc diameter aperture and multiple apertures extracted along the spatial axis of the galaxy remain unchanged from RJ06a and Rothberg & Joseph (2006b, hereafter RJ06b). A log of the observations can be found in Table 3 of RJ06a. An aperture of diameter 1.53 h−1 kpc was selected to match the size used in P98 and to remain consistent with the works of Jorgensen et al. (1995) and Smith et al. (1995) which brought a large body of spectroscopic data onto a common system.
Once the one-dimensional, flux-calibrated spectra were extracted, the processing differed from that of RJ06a and RJ06b. Observations longward of 0.89 μm are affected by strong H2O telluric absorption. Telluric corrections were applied to objects with redshifts of z ⩾ 0.02 using normalized spectrophotometric standards with the TELLURIC task in IRAF. σ○, rotation curves (V(r)), and σ-curves were measured using continuum normalized spectra. The continuum for each object was normalized by fitting a second-order Legendre polynomial to specific wavelength regions, rather than a fifth-order spline3 fit to the entire order (as in RJ06a and RJ06b). Five regions were used for the fitting corresponding to those defined in Cenarro et al. (2001) as continua for the calcium triplet: (0.8474–0.8484 μm, 0.8563–0.8577 μm, 0.8619–0.8642 μm, 0.8700–0.8725 μm, and 0.8776–0.8792 μm). The choice to use specific wavelength regions and a low-order polynomial was made to avoid distorting the shape of the CaT absorption lines. Finally, rather than using IRAF to interpolate over bad pixels caused by imperfect background subtraction, which can also alter the shape of the CaT absorption lines, bad pixel masks were created to be used with the new version of the IDL pixel-fitting routine VELOCDISP used to measure velocity dispersions in RJ06a,b. An error spectrum was also generated for each object and was used in fitting σ. The error spectrum was computed using the variance array generated by IRAF, which takes into account the gain and read-noise of the array, and the polynomial fit used in the continuum normalization.
3.1.2. Infrared Spectroscopy
GNIRS
New near-IR spectroscopic observations centered on the 2.29 μm CO feature were obtained with the Gemini Near-Infrared Spectrograph (GNIRS; Elias et al. 2006) on Gemini-South in queue mode, Program GS-2007A-Q-17 (P.I.: Rothberg). GNIRS uses a 1024 × 1024 ALADDIN III InSb array and covers a wavelength range from 0.95 to 5.5 μm. The observations were made with the 111 l/mm grating and Short Camera using a 03 × 99'' long slit. The 03 slit width projects onto two pixels in the dispersion direction, while the slit length projects onto 1012 pixels along the spatial axis, providing a spatial resolution of ∼009 pixel−1. The K* order sorting filter was used and the tilt of the grating was adjusted for each galaxy and template star in order to center the 2.29 μm 12CO (2,0) band head feature on the array. This provided a resolution of R ∼ 6200 (or ∼48 km s−1) and a maximum usable wavelength range of ∼ 0.19 μm (λ ∼ 2.219–2.381 μm). The P.A. of the slit was rotated to match the photometric K-band major axis of each galaxy. All observations were nodded along the slit by ± 22'', so that each exposure remained on the target. The observation log detailing the integration times and P.A.s is tabulated in Table 2.
Table 2. GNIRS Spectroscopic Observation Log
| Galaxy Name | Integration Time | P.A. |
|---|---|---|
| (s) | (degrees) | |
| Merger remnants | ||
| AM 0612 − 373 | 6000 | 40.0 |
| NGC 2418 | 3600 | 30.8 |
| NGC 2914 | 3600 | 20.5 |
| NGC 5018 | 3090 | 90.0 |
| AM 1419 − 263 | 7200 | 69.0 |
| AM 2038 − 382 | 6000 | −45.0 |
| Elliptical | ||
| NGC 5812 | 2160 | 61.4 |
| Template stars | ||
| HD 99724 | 35 | 0 |
| HD 100059 | 90 | 0 |
| HD 100347 | 90 | 0 |
| HD 100745 | 90 | 0 |
Download table as: ASCIITypeset image
Telluric standards (A0V stars) were observed for each object at similar air masses. In addition to telluric standards, a G8III, K0III, K3III, and an M0III star were observed for use as template stars in the kinematic analysis. These stars were observed in the same manner as the target galaxies. These stars had been previously observed with the optical spectrograph ESI. Ar–Xe arcs and internal flats were taken after observations of each object and standard star. A P.A. = 0 was used for the observations of the four template stars.
The long-slit GNIRS spectra were reduced using the GNIRS tasks in the GEMINI IRAF Package (ver. 1.9). In several cases, alternating vertical stripes were present in the data set. The stripping is due to offset bias levels among the 32 amplifiers and were corrected using the NVNOISE task. The data were then run through the task NSPREPARE which corrects for a constant bias offset, detects and corrects for nonlinearity, calculates a variance array, checks for and flags bad data, detects cosmic ray (CR) events, and corrects the world coordinate system. The task also calculates any shifts in data between the first and subsequent images. Next, flats and bad pixel masks were constructed using the task NSFLAT. Separate flats and bad pixel masks were constructed for each galaxy and template star observed. Wavelength calibration was done using spectra which contained both Ar and Xe lines. Wavelength solutions were computed using the task NSWAVELENGTH after each arc line was manually identified. Second-order Chebyshev polynomials were used to obtain wavelength solutions. Since a separate set of arcs and flats were obtained for each galaxy and template star, each object has its own wavelength solution. The rms of the wavelength solutions were ∼0.1 Å.
Next, each data set was processed with the task NSREDUCE, which flattens, sky-subtracts and trims the data images. The observations were conducted in a nod A-B mode so that each frame contains object spectra, allowing for pair image subtractions to be made. NSTRANSFORM was then used to apply the wavelength solutions to the data sets. Finally, the task NSCOMBINE was used to create a single, final image. This task shifts and combines input images. The positive spectrum of each sky-subtracted pair was shifted to make a final positive image that is the median combination of all the data. Observations of AM 1419 − 263 and AM 2038 − 382 were spread over two nights. Each night's data set was flat-fielded, wavelength calibrated, and trimmed separately.
Once a two-dimensional image was created, individual spectra were then extracted using the task NSEXTRACT. The aperture used for the central velocity dispersions corresponded to 1.53 h−1 kpc. Telluric standards and template stars were extracted in apertures corresponding to the full width at half-maximum (FWHM) of their flux profile (as measured in the spatial direction). In addition to a central aperture, multiple apertures were extracted along the spatial axis to construct rotation curves and measure the variation of σ as a function of radial position. The choice of extraction aperture size was based on signal-to-noise ratio (S/N) considerations and varied both for each galaxy and within each galaxy.
The extracted galaxy and template star spectra were then divided by the telluric standards to remove atmospheric absorption lines and remove the instrumental signature. Heliocentric corrections were computed using the IRAF task RVCORRECT and applied with DOPCOR. The spectral shape of the data was restored by multiplying the object spectra by a blackbody of T = 9300 K, corresponding to an A0V star (telluric standard) and using the IRAF task MK1DSPEC.
σ ○, V(r), and σ-curves were measured using continuum normalized spectra. The continuum of each the object was normalized to unity using the task CONTINUUM. A second-order Legendre polynomial was fitted to specific regions of the spectra. These continuum regions are those defined by Kleinmann & Hall (1986) and Förster Schreiber (2000). These regions are 2.211–2.214 μm, 2.216–2.219 μm, 2.2495–2.2525 μm, 2.2565–2.2595 μm, 2.2690–2.2720 μm, 2745–2.2775 μm, and 2.2885–2.2915 μm. No true continuum exists redward of the 12CO (2–0) overtone feature. Deviant pixels were identified and bad pixel masks were created to be used with the new version of the IDL routine VELOCDISP. An error spectrum was generated for each object in the same manner as was done for the optical observations.
NIRSPEC
Near-IR observations centered on the 2.29 μm CO feature were also obtained with the NIRSPEC spectrograph (McLean et al. 1998) on the W. M. Keck II 10 m telescope. Briefly, the observations were made in the echelle mode using a slit width of 0432 (dispersion) and a slit length of 24'' slit (spatial). This gives a resolution of R ≃ 12 km s−1 or R ≃ 25,000. The P.A. of the slit was aligned with the photometric K-band major axis of each galaxy. The reduction of the data and spectral extraction method used for the central 1.53 h−1 kpc diameter aperture remain unchanged from RJ06a. A log of the observations can be found in Table 3 of RJ06a.
Once the one-dimensional spectra were extracted, the processing differed from that of RJ06a. The spectral shape of the data was restored by multiplying the object spectra by a blackbody of T = 9300 K, corresponding to that of an A0V star (telluric standard) using the IRAF task MK1DSPEC. Like the GNIRS data, the continuum was then normalized by fitting a second-order Legendre polynomial to specific wavelength ranges redward of the CO feature. Since the wavelength range of the NIRSPEC data is smaller than that of the GNIRS data, only two continuum regions were used for normalization, 2.2745–2.2775 μm and 2.2885–2.2915 μm. This normalization is different than that employed in RJ06a. In that paper, a first-order Legendre polynomial was fitted over the entire spectrum blueward of the 12CO (2,0) band head, including the Mg i absorption feature at 2.2814 μm. The wavelength range used for analysis is λ = 2.274–2.302 μm, which is larger than that used in RJ06a. An error spectrum was generated for each object in the same manner as was done for the ESI and GNIRS observations.
3.2. I-band Images
F814W images of nine merger remnants were obtained from the public HST archives. Seven of the mergers were observed with Advanced Camera for Surveys (ACS) instrument, and two mergers were observed with the Wide Field Planetary Camera 2 (WFPC2). Table 3 lists the total integration times and Proposal IDs associated with the various HST data sets. Observations using the F814W filter was selected because it closely matches the Cousins I-band filter. The zero-point differences between the F814W and Cousins I-band are relatively small. Given that the transformations are less than a few hundredths of a magnitude and depend on the color of the object, no change to the instrumental zero point was made. Throughout the remainder of the paper, F814W will be referred to simply as I band.
Table 3. Imaging Observation Log
| Galaxy | Filters | Integration Time | Seeinga |
|---|---|---|---|
| Name | (s) | (arcsec) | |
| Merger remnants | |||
| NGC 1614 | F814Wb, Jc, Hc | 720, 900, 1140 | 0.049, 1.23, 0.70 |
| AM 0612 − 373 | Jd, He | 7.8, 600 | 2.35, 0.96 |
| NGC 2418 | Jc, Hc | 840, 1920 | 0.96, 0.90 |
| NGC 2623 | F814Wb,f, Je, He | 3190, 600, 600 | 0.049, 0.79, 0.63 |
| NGC 2914 | Jd, Hd | 7.8, 7.8 | 2.38, 2.51 |
| NGC 3256 | F814Wb, Je, He | 760, 600, 1200 | 0.049, 1.12, 1.44 |
| NGC 4194 | F814Wg, Jc, Hc | 2320, 900, 1800 | 0.049, 0.78, 0.73 |
| NGC 5018 | F814Wh,i, Jd, Hd | 7040, 7.8, 7.8 | 0.099, 2.67, 2.76 |
| Arp 193 | F814Wb, Jc, Hc | 740, 720, 1440 | 0.049, 0.75, 0.76 |
| AM 1419 − 263 | Je, He | 600, 1200 | 1.16, 0.89 |
| AM 2038 − 382 | Jd, Hd | 7.8, 7.8 | 2.48, 2.51 |
| AM 2055 − 425 | F814Wb, Jd, Hd | 760, 7.8, 7.8 | 0.049, 2.54, 2.54 |
| NGC 7252 | F814Wj, Je, He | 2460, 360, 720 | 0.046, 1.62, 1.01 |
| IC 5298 | F814Wb, Je, He | 730, 3900, 3720 | 0.049, 0.87, 0.57 |
| Elliptical galaxies | |||
| NGC 315 | Kd | 7.8 | 2.63 |
| NGC 1052 | Kd | 7.8 | 2.67 |
| NGC 1419 | Kd | 7.8 | 2.60 |
| NGC 2974 | Kd | 7.8 | 2.57 |
Notes. aPlatescale given for HST observations. bHST/ACS Program ID 10592, PI: Evans. cObserved with NSFCAM at IRTF. dFrom 2MASS archive. eObserved with QUIRC at UH 2.2 m telescope. fHST/ACS Program ID 9735, PI: Whitmore. gHST/ACS Program ID 10769, PI: Kaaret. hHST/WFPC2 Program ID 6587, PI: Richstone. iHST/WFPC2 Program ID 7468, PI: Schweizer. jHST/WFPC2 Program ID 5416, PI: Whitmore.
Download table as: ASCIITypeset image
ACS/WFC is comprised of two 4096 × 2048 pixel Scientific Imaging Technologies (SITe) CCDs, each with a platescale of 0049 pixel−1, providing a field of view (FOV) ∼ 202'' × 202''. There is a gap of 50 pixels (245) between the two CCDs. The gap was filled in by dithering the observations (Programs 10592 and 10769) or combining observations from two separate programs of the same object (NGC 2623; Programs 9735 and 10592) with different pointings. Flat-fielded, calibrated individual exposures were obtained from the archive for NGC 1614, NGC 2623, NGC 3256, NGC 4194, Arp 193, AM 2055 − 425, and IC 5298. HST Program IDs corresponding to each target are listed in Table 3. The data were then processed manually using the MULTIDRIZZLE task in STSDAS to remove CR hits, rotate the images to 0°, and combine multiple exposures into a single mosaic for each galaxy. Manual MULTIDRIZZLE processing was selected as the archive pipeline processing often produces spurious photometric results in cases of saturated pixels or non-standard observing setups. A number of saturated pixels in the central regions were found to be present in NGC 1614, NGC 3256, and NGC 4194. Nearly all CR hits and chip artifacts were successfully removed for NGC 2623 and NGC 4194. Nominally, observing programs employ a CR-SPLIT, two separate exposures at the same pointing or multiple dithering positions to remove CRs and artifacts. However, the remaining ACS/WFC observations from Program 10592 employed a dithering scheme in which two exposures were taken, each at a different pointing. The chip gap can be filled in this manner, but CR removal in the gap becomes difficult. This resulted in final images containing noticeable CR hits and bad pixels in the chip gap. These pixels were masked during the processing and ignored for the analysis.
WFPC2 is compromised of four 800 × 800 pixel Loral CCDs. Three of the CCDs have a platescale of 0099 arranged in an "L" shape (WF2, WF3, and WF4), imaged at f/12.9, resulting in a 160'' × 160'' FOV, with a missing quadrant. The fourth CCD is the Planetary Camera (PC) chip, with a 0046 platescale, which gives a 368 × 368 FOV imaged at f/28.3. If the WFPC2 observations are single pointings, significant fractions of any galaxy larger than 36'' in diameter will be unobserved. WFPC2 archival data for two merger remnants, NGC 5018 and NGC 7252, were obtained from the archives. The HST Program IDs are noted in Table 3. Observations of NGC 5018 included two separate pointings, rotated ∼180° from each other, thereby covering most of the galaxy. The observation of NGC 7252 was a single pointing, and only data from the PC chip was used.
The reduction processes used for the WFPC2 observations were observation specific. The NGC 5018 data were processed using the task MULTIDRIZZLE. Since the platescales vary between the PC and WF chips, the final mosaic was drizzled to the resolution of the WF chips, resulting in an image ∼ 233'' in diameter, and centered on the nucleus. The MULTIDRIZZLE task includes CR rejection, bad pixel rejection and correction for geometric distortions. The PC chip observations of NGC 7252 were reduced using calibrated WFPC2 science images obtained from the HST archives and processed with the STSDAS task WARMPIX and CRREJ to fix hot pixel and remove CRs. The images were then corrected for geometric distortion.
Appendix A shows the nine F814W and their corresponding K-band images. The images are shown in reverse grayscale with a logarithmic stretch. A metric scale bar is superposed on both sets of images. The HST observations were used to measure I-band surface brightnesses, absolute magnitudes and were compared directly with K-band imaging to obtain (I − K) images and photometry. This required interpolation of the data to match the resolution of the K-band data that were obtained at the University of Hawaii 2.2 m telescope on Mauna Kea using the Quick Infrared Camera (QUIRC) which has a platescale = 0189 pixel−1. The ACS/WFC data were re-reduced with MULTIDRIZZLE, this time changing the parameter FINALSCALE to match the platescale of QUIRC. Rotation and alignment with the K-band QUIRC data were checked using the task GEOMAP. The images for each galaxy were then convolved with a Gaussian (using the task GAUSS) to match the seeing of the K-band images. The K-band seeing was estimated using the mean FWHM and ellipticity of foreground stars in each of the K-band images and then used as input parameters for the task GAUSS. The images were then aligned using the IRAF task IMSHIFT and trimmed to match the size of the QUIRC array.
3.3. Near-IR Images
The K-band images of the merger remnants were originally presented in RJ04. All of the K-band images were obtained using QUIRC, a 1024 × 1024 pixel HgCdTe infrared array (Hodapp et al. 1996), with a 0189 pixel−1 platescale (FOV ∼ 1935 × 1935), located at the f/10 focus of the University of Hawaii 2.2 m telescope on Mauna Kea. The observations and processing of the K-band data for the merger remnants and NGC 5812 are described in Section 3 of RJ04. The methods used for observing and reducing the J- and H-band images are the same as the methods used for the K-band data.
New J- and H-band photometry are presented here. The J- and H-band observations were obtained at either the UH 2.2 m telescope with QUIRC or with NSFCam (Shure et al. 1994) on the NASA Infrared Telescope Facility (f/35 focus). NSFCAM is a 256 × 256 pixel indium antimonide (InSb) detector with a 03 pixel−1 platescale and FOV ∼ 76'' × 76''. The J- and H-band filters used for the observations conform to the Mauna Kea Observatory (MKO) Filter specifications (Simons & Tokunaga 2002; Tokunaga et al. 2002; Tokunaga & Vacca 2005), for all galaxies with the exception of IC 5298, which was observed with an older filter set, but transformed to the MKO filters using the information available on the NSFCam homepage (http://irtfweb.ifa.hawaii.edu/~nsfcam/mkfilters.html). Table 3 lists the observing information for the newly presented near-IR observations, including telescope, instrument, total integration time and seeing. The integration time and seeing for the K-band observations of the merger remnants and NGC 5812 obtained at the UH 2.2 m telescope can be found in Table 1 of RJ04 or Table 2 of RJ06a.
Supplemental J- and H-band photometry of merger remnants were obtained from the Two Micron All Sky Survey (2MASS) archives (Skrutskie et al. 2006) to supplement the near-IR observations. The data obtained from the 2MASS archives were Survey Atlas FITS images, with a resampled platescale of 1'' pixel−1 and a total integration time of 7.8 s. No additional processing of the 2MASS data was done. Table 3 lists the 2MASS data used for the merger remnants. The photometric differences between KMKO and KS ∼ 0.02 mag which are within the photometric errors. Thus, for the purposes of this paper, KMKO ∼ KS, and will simply be referred to as K band for the remainder of the paper.
K-band photometry, using the KS filter for 18 of the 23 galaxies the comparison sample of ellipticals was taken from Pahre (1999, hereafter P99). K-band photometry for four ellipticals, NGC 315, NGC 1052, NGC 1419, and NGC 2974, were obtained from the 2MASS archives, and the fifth, NGC 5812, was observed with QUIRC on the UH 2.2 m telescope along with the merger remnants. As with the merger remnants, no additional processing of the 2MASS K-band data was done for the ellipticals.
4. DATA ANALYSIS
4.1. Velocity Dispersions
The details of the method and techniques used to measure σ are given in RJ06a. Briefly, in pixel space a direct fitting routine is used to measure σ. This method is similar to the technique described in Rix & White (1992). The template stars are convolved with a Gauss–Hermite polynomial, which is a modified Gaussian (van der Marel & Franx 1993). The fitting function has five parameters: the line strength (γ), which measures the ratio of the equivalent width (EW) of the galaxy to that of the template star, the mean recessional velocity (υ○), the central velocity dispersion (σ○), the skewness (h3), and kurtosis (h4). The last two parameters characterize the departures from a Gaussian shape. The parameters are simultaneously fitted to the data over a specific wavelength range. A few changes have been made to the fitting method, and are detailed here.
The new version of the IDL program VELOCDISP, used to measure σ, includes a bad pixel mask option to mask out features such as residuals from incomplete background subtraction or strong emission lines which may affect the fit. The earlier version of the program used an equal weighting scheme for each pixel to measure the fitting errors and relied on interpolating over bad pixels using tasks in IRAF. The new version uses the output error array from IRAF to weight each pixel in the fitting routine. The best-fit parameters are those that minimize the χν2 and rms for the differences between the broadened template and galaxy.
Barth et al. (2002) defined an optimal fitting region of 0.8480–0.8690 μm for the Ca triplet absorption features. This region was adopted for the work in RJ06a, RJ06b, and this paper. Barth et al. (2002) also excluded a small region between 0.859 and 0.864 μm due to possible contamination from [Fe ii] at 0.8167 μm. Rather than exclude this entire region in all galaxies, bad pixel masks were used to mask out specific emission lines, including [C ii] at 0.8579 μm (Danziger & Aaronson 1974), Pa14 at 0.8598 μm, and [Fe ii] at 0.8617 μm in emission.
The fitting regions used for the CO absorption lines varied between the GNIRS and NIRSPEC data owing to their different wavelength coverage. The region between 2.25 and 2.37 μm was used for all of the GNIRS data. This region is somewhat shorter than the full available wavelength range in the data. The reason for using a slightly shorter range is to avoid cutting into the beginning of the 12CO (5–3) band head at 2.382 μm and the Na i doublet at 2.206 and 2.208 μm. The range includes stellar the absorption lines of Ca i triplet at 2.26 μm, Mg i at 2.28 μm, and the 12CO (2,0), 12CO (3,1), 13CO (2,0), and 12CO (4–2) band heads. The wavelength range used for the NIRSPEC data was 2.274–2.302 μm. This was selected as the largest wavelength range common to both NGC 1614 and NGC 2623 and includes Mg i and only the 12CO (2,0) band head. This is slightly larger than the range used in RJ06a.
In order to eliminate the possibility of variations introduced by using different template stars for each wavelength region (since the EW can vary within the same spectral class), the same template stars were used for both the CaT and CO measurements. A total of 19 template stars were used (four observed with both ESI and GNIRS), including red giant branch (RGB), asymptotic giant branch (AGB), and red supergiant (RSG) stars. In order to compile a large enough sample of template stars, additional spectra were obtained from the literature and convolved to the same resolution as the observed spectra. Additional (CaT) optical spectra were taken from Cenarro et al. (2001), Marrese et al. (2003), and Valdes et al. (2004). Supplemental CO template spectra were taken from version 1.5 of the online Gemini Spectral Template Library (GSTL; Winge et al. 2009) and Wallace & Hinkle (1996). Since the resolution of the NIRSPEC data (R∼ 25,000) is greater than that of the GNIRS data (R ∼ 6200), only the seven template stars from Wallace & Hinkle (1996) were used because the resolution of those spectra is R > 45,000. The Wallace & Hinkle spectra were convolved with a Gaussian to match the resolution of NIRSPEC. All of the template stars used for the fitting and their sources are listed in Table 4 in order of spectral type.
Table 4. Spectroscopic Template Stars
| Type | Name | R.A. | Decl. | Optical Source | Infrared Source |
|---|---|---|---|---|---|
| (J2000) | (J2000) | ||||
| G1III | α Sge (HD 185758) | 19h40m05s | 18°00'50'' | Marrese et al. (2003) | Wallace & Hinkle (1996) |
| G5II | HD 36079 | 05h28m15s | −20°45'33'' | Cenarro et al. (2001) | GSTLv1.5 |
| G8III | HD 100347 | 05h23m56s | −07°48'29'' | RJ06a | This paper |
| G8III | HD 35369 | 11h32m39s | −18°52'15'' | Valdes et al. (2004) | GSTLv1.5 |
| G9III | HD 224353 | 23h57m10s | −44°51'35'' | Valdes et al. (2004) | GSTLv1.5 |
| K0III | HD 4188 | 00h44m11s | −10°36'34'' | Valdes et al. (2004) | GSTLv1.5 |
| K0III | HD 100059 | 11h30m43s | −19°53'46'' | RJ06a | This Paper |
| K0III | HD 206067 | 21h39m33s | 02°14'36'' | Valdes et al. (2004) | GSTLv1.5 |
| K1III | HD 108381a | 12h26m56s | 28°16'06'' | Valdes et al. (2004) | ... |
| K1.5III | α Boo (HD 124897) | 14h15m39s | 19°10'56'' | Valdes et al. (2004) | Wallace & Hinkle (1996) |
| K3III | HD 99724 | 11h28m15s | −18°38'32'' | RJ06a | This paper |
| M0III | λ Dra (HD 100029) | 11h31m24s | 69°19'51'' | Marrese et al. (2003) | Wallace & Hinkle (1996) |
| M0III | HD 100745 | 11h35m30s | −19°31'59'' | RJ06a | This paper |
| M3IIIb | HD 112300 | 12h55m36s | 03°23'50'' | Valdes et al. (2004) | GSTLv1.5 |
| M7.5IIIb | Rx Boo (HD 126327) | 14h24m11s | 25°42'13'' | Valdes et al. (2004) | Wallace & Hinkle (1996) |
| K1.5b | ζ Cep (HD 210745) | 22h10m51s | 58°12'04'' | Cenarro et al. (2001) | Wallace & Hinkle (1996) |
| M1Iab | α Ori (HD 39801) | 05h55m10s | 07°24'25'' | Valdes et al. (2004) | Wallace & Hinkle (1996) |
| M5Iab | α Her (HD 156014) | 17h14m38s | 14°23'25'' | Cenarro et al. (2001) | Wallace & Hinkle (1996) |
Notes. GSTLv1.5: Gemini Spectral Template Library Version 1.5. aJames & Mobasher (1999) used this stellar template for their CO σ○ measurements, it is used in this paper to test CaT observations. bAGB star.
Download table as: ASCIITypeset image
Table 5 shows the best-fit results for the derived σ○ and heliocentric recessional velocity (cz) for each galaxy. Included in the table are values for both the CaT and CO stellar absorption lines along with the best-fit templates for each. The errors in Table 5 were calculated by VELOCDISP using the error spectrum for each galaxy. A comparison was made with Monte Carlo simulations to test the robustness of the fitting program as a function of template stars and S/N in recovering the properties. The testing for each galaxy is based on 1000 realizations of a template star convolved with a Gauss–Hermite polynomial of known properties, degraded to the S/N of the galaxy, with random Poisson noise added. The template stars were then tested with the convolved "fake galaxy" spectra to test how well the known properties could be recovered. The spreads in the errors for these tests were found to be nearly the same as the fitting errors shown in Table 5. Appendix B shows the CaT and CO spectra plotted for the merger remnants and the E0 elliptical. The changes to the continuum normalization, wavelength ranges, and update to VELOCDISP resulted in a mean change of +5 km s−1 to the σ○,CaT for the sample of merger remnants (and NGC 5812), and +1.5 km s−1 for the two previously observed σ○,CO obtained with NIRSPEC.
Table 5. Velocity Dispersions of the Merger Remnants
| Merger Name | CaT σ○ | CO σ○ | CaT V☉ | CO V☉ | CaT Template | CO Template |
|---|---|---|---|---|---|---|
| (km s−1) | (km s−1) | (km s−1) | (km s−1) | Type/Star | Type/Star | |
| NGC 1614 | 219 ± 3 | 133 ± 3 | 4781 ± 3 | 4764 ± 3 | K0III HD 4188 | M7.5III Rx Boo |
| AM 0612 − 373 | 286 ± 9 | 240 ± 9 | 9737 ± 8 | 9761 ± 7 | G9III HD 224533 | M0III HD 100745 |
| NGC 2418 | 282 ± 3 | 245 ± 7 | 5040 ± 3 | 5161 ± 7 | G8III HD 100347 | K1.5III α Boo |
| NGC 2623 | 174 ± 3 | 152 ± 4 | 5550 ± 2 | 5547 ± 5 | G5II HD 36079 | M0III λ Dra |
| NGC 2914 | 178 ± 2 | 179 ± 6 | 3157 ± 2 | 3161 ± 5 | K0III HD 100059 | M0III HD 100745 |
| NGC 3256 | 239 ± 4 | 111a ± 20 | 2808 ± 5 | ... | K0III HD 206067 | ... |
| NGC 4194 | 103 ± 2 | 98b ± 25 | 2495 ± 2 | 2523 | G8III HD 35369 | K1III HD 108381 |
| NGC 5018 | 222 ± 2 | 243 ± 7 | 2814 ± 2 | 2766 ± 5 | K0III HD 100059 | M0III HD 100745 |
| Arp 193 | 229 ± 4 | 143c ± 5 | 6967 ± 4 | ... | K0III HD 206067 | ... |
| AM 1419 − 263 | 258 ± 3 | 262 ± 6 | 6752 ± 3 | 6764 ± 5 | K0III HD 100059 | M0III HD 100745 |
| AM 2038 − 382 | 256 ± 5 | 207 ± 4 | 6090 ± 5 | 6118 ± 4 | G8III HD 100347 | K3III HD 99724 |
| AM 2055 − 425 | 207 ± 7 | 137d ± 15 | 12883 ± 6 | 12840 | G9III HD 224533 | M0III HD 25472 |
| NGC 7252 | 160 ± 3 | 119b ± 19 | 4795 ± 2 | 4743 | G8III HD 35369 | K1III HD 108381 |
| IC 5298 | 187 ± 4 | 150e ± 28 | 8230 ± 3 | ... | K0III HD 4188 | M0III HD 183439 |
Notes. aOliva et al. (1995). bJames et al. (1999). cHinz & Rieke (2006). dGenzel et al. (2001), using the 1.58–1.62 μm region. eShier et al. (1996). Data from literature is corrected to a 1.53 h−1 kpc aperture. Some data from the literature do not include error estimates or information on the type of template stars used for measuring σ○ or derived recession velocities.
Download table as: ASCIITypeset image
4.1.1. Velocity Dispersions from the Literature
Two sets of additional σ○ were obtained from the literature to supplement the observations. The first set consists of σ○,CO for six merger remnants (NGC 3256, NGC 4194, Arp 193, AM 2055 − 425, NGC 7252, and IC 5298) as is noted in Table 5. The second set consists of optical and near-IR σ○ for the comparison sample of elliptical galaxies, and are listed in Table 6.
Table 6. Velocity Dispersions of the Comparison Sample of Ellipticals
| Elliptical Galaxy Name | CaT σ○ | CO σ○ |
|---|---|---|
| (km s−1) | (km s−1) | |
| NGC 221 | 69a,b ± 2 | 60c ± 8 |
| NGC 315 | 351d ± 16 | 324c ± 59 |
| NGC 821 | 197a,e ± 20 | 188c ± 17 |
| NGC 1052 | 196a,f ± 4 | 211g ± 20 |
| NGC 1316 | 243h ± 9 | 212i ± 20 |
| NGC 1344 | 166h ± 7 | 158i ± 20 |
| NGC 1374 | 180h ± 8 | 181i ± 20 |
| NGC 1379 | 127h ± 5 | 126i ± 20 |
| NGC 1399 | 325h ± 15 | 336i ± 20 |
| NGC 1404 | 230h ± 10 | 204i ± 20 |
| NGC 1407 | 283h ± 13 | 297c ± 40 |
| NGC 1419 | 110j ± 6 | 116i ± 20 |
| NGC 1427 | 172h ± 8 | 174i ± 20 |
| NGC 2974 | 255k ± 12 | 262c ± 19 |
| NGC 3377 | 135h ± 4 | 134c ± 20 |
| NGC 3379 | 185a,l ± 2 | 235g ± 20 |
| NGC 4365 | 240a,l ± 3 | 262g ± 20 |
| NGC 4472 | 269a,l ± 3 | 291g ± 20 |
| NGC 4486 | 361a,m ± 37 | 310n ± 20 |
| NGC 5128 | 145h ± 6 | 190c ± 13 |
| NGC 5812 | 248a,o ± 2 | 230a ± 6 |
| NGC 7619 | 296k ± 11 | 246c ± 47 |
| NGC 7626 | 265h ± 10 | 313g ± 20 |
Notes. Data from literature is corrected to a 1.53 h−1 kpc aperture. Nearly all of the data from the literature do not include information on the type of template stars used for measuring σ○ or derived recession velocities, so they are not included in this table. aCaT ii triplet. bDressler (1984). cSilge & Gebhardt (2003). dFaber et al. (1989). eTerlevich et al. (1990). fBarth et al. (2002). gOliva et al. (1995). hPahre (1999). iSilva et al. (2008). jKuntschner (2000). kJorgensen et al. (1995). lCenarro et al. (2003). mvan der Marel (1994). nOliva et al. (1999). oThis paper.
Download table as: ASCIITypeset image
In order to reduce possible errors introduced by measurements of kinematic properties made with different aperture sizes, the σ○ of the comparison sample of ellipticals and σ○,CO of merger remnants taken from the literature, were corrected to a common aperture diameter of 1.53 h−1 kpc (34 diameter circular aperture at the distance of Coma). This is the same aperture diameter used to measure σ○ in the merger remnants (and the E0 NGC 5812). As noted in P99, Jorgensen et al. (1995) and Smith et al. (1997) explored aperture effects in early-type galaxies and found that σ scales with aperture size as
where the aperture diameter d○ = 1.53 h−1 kpc and d is defined by
x and y are the slit width and spectral extraction aperture, respectively, in arcseconds, n is the number of parsecs in 1'' for the galaxy, and α = 0.04 on average. Jorgensen et al. (1995) and Smith et al. (1997) both used this algorithm to attempt to bring spectroscopically derived measurements onto a common system. The same standard aperture of 1.53 h−1 has been adopted here. These corrections were not employed by SG03, nor in RJ06a for literature sources, but are used here. Table 6 shows the corrected σ○,CaT and σ○,CO for the comparison sample of elliptical galaxies. The errors shown in Table 6 come from the various sources cited for the kinematic measurements.
4.2. Global Photometric Parameters
Photometry was performed on the F814W HST/ACS images to measure the global photometric parameters: total luminosity (MI), the radius containing half the total light or effective radius (Reff), and the mean surface brightness within the effective radius 〈μI〉eff. MI was measured by summing the flux in circular isophotes from the center of the galaxy to the edge of the array. Reff and 〈μK〉eff were measured using circular isophotes with the ELLIPSE task in the STSDAS package in IRAF. The galaxy centers were held fixed and defined from the K-band images. Foreground stars, CRs and artifacts were masked using a bad pixel mask and ignored in the isophote fitting and flux measurement. The area in usable pixels for each annulus, the summed flux in each isophote, and the fitting errors from ELLIPSE were put into an IDL fitting program which computes the surface brightness, S/N, and errors at each isophotal radius. A separate IDL routine was used to fit an r1/4 de Vaucouleurs profile to the data (de Vaucouleurs 1953). The K-band global photometric parameters MK, Reff, and 〈μK〉eff for the merger remnants and NGC 5812 were taken directly from RJ06a. The parameters were measured in a similar manner and using the same IRAF and IDL routines. The I-band and K-band photometry for the merger remnants is listed in Table 7.
Table 7. Global Parameters
| Galaxy | MI | I Reff | 〈μI〉eff | MK | K Reff | 〈μK〉eff | log LIRa | Td | log Mdust | log L1.4 GHz | Mdyn,Opt |
|---|---|---|---|---|---|---|---|---|---|---|---|
| Name | (mag) | (log kpc) | (mag arcsec−2) | (mag) | (log kpc) | (mag arcsec−2) | (L☉) | (K) | (M☉) | (W Hz−1) | (×1011 M☉) |
| Merger Remnants | |||||||||||
| NGC 1614 | −22.21 | 0.41 | 18.22 | −24.74 | 0.22 | 14.92 | 11.59 | 45 | 6.1 | 22.6h | 1.7 |
| AM 0612–373 | ... | ... | ... | −25.65 | 0.67 | 16.08 | 10.44*b | 31 | 5.4 | 21.7i | ... |
| NGC 2418 | ... | ... | ... | −25.31 | 0.68 | 16.40 | 9.89*b | 22 | 5.8 | 21.6j | ... |
| NGC 2623 | −21.78 | 0.32 | 18.15 | −24.22 | 0.12 | 14.83 | 11.48 | 44 | 6.1 | 22.7h | 0.9 |
| NGC 2914 | ... | ... | ... | −23.51 | 0.14 | 15.82 | 9.51*b | 23 | 5.5 | ... | ... |
| NGC 3256 | −22.40 | 0.19 | 16.79 | −24.72 | 0.25 | 14.83 | 11.59 | 44 | 6.2 | 23.0k | 1.2 |
| NGC 4194 | −20.99 | 0.22 | 18.66 | −23.21 | −0.24 | 14.03 | 10.88 | 44 | 5.4 | 21.9h | 0.2 |
| NGC 5018 | −21.93d | 0.52 | 18.96 | −25.15 | 0.41 | 15.33 | 9.79*c | 35 | 4.8 | 20.5l | 2.3 |
| Arp 193 | −22.08 | 0.78 | 20.28 | −24.40 | 0.19 | 15.10 | 11.58 | 39 | 6.5 | 23.0h | 4.4 |
| AM 1419–263 | ... | ... | ... | −24.94 | 0.55 | 16.25 | 10.26*b | 21 | 6.3 | ... | ... |
| AM 2038–382 | ... | ... | ... | −24.70 | 0.24 | 15.12 | 10.48e | 39 | 5.2 | 21.2 | ... |
| AM 2055–425 | −22.85 | 0.78 | 19.57 | −25.08 | 0.32 | 14.93 | 11.96 | 50 | 6.2 | ... | 3.6 |
| NGC 7252 | −21.10d | 0.49 | 19.39 | −24.84 | 0.40 | 15.53 | 10.76c | 36 | 5.8 | 22.0 | 1.1 |
| IC 5298 | −22.42 | 0.36 | 17.61 | −25.03 | 0.28 | 14.82 | 11.52 | 41 | 6.2 | 22.5h | 1.1 |
| Elliptical Galaxies | |||||||||||
| NGC 221 | −17.60 | −0.92 | 16.31 | −19.64 | −0.85 | 14.64 | 6.66* | 19 | 3.2 | ... | 0.008 |
| NGC 315f | ... | ... | ... | −25.90 | 0.72 | 15.82 | 9.93* | 41 | 4.3 | 23.6 | ... |
| NGC 821 | −22.15 | 0.57 | 19.30 | −24.14 | 0.43 | 16.31 | 9.02* | 27 | 4.3 | ... | 2.0 |
| NGC 1052f | −22.23 | 0.40 | 18.35 | −24.13 | 0.20 | 15.20 | 9.34 | 36 | 4.1 | 22.6 | 1.3 |
| NGC 1316 | −24.39 | 0.98 | 19.08 | −26.01 | 0.59 | 16.78 | 9.83 | 31 | 5.2 | 21.5 | 7.9 |
| NGC 1344 | −22.52 | 0.50 | 18.55 | −24.29 | 0.48 | 16.69 | 8.90*b | 22 | 4.7 | ... | 1.2 |
| NGC 1374 | −21.40 | 0.35 | 18.94 | −23.49 | 0.24 | 16.40 | 9.24*b | 30 | 3.9 | ... | 1.0 |
| NGC 1379 | −21.60 | 0.45 | 19.22 | −23.44 | 0.48 | 17.57 | 8.45* | 32 | 3.1 | ... | 0.6 |
| NGC 1399 | −22.96 | 0.56 | 18.43 | −25.11 | 0.48 | 15.90 | 8.65* | 29 | 3.7 | ... | 5.3 |
| NGC 1404 | −22.78 | 0.44 | 18.02 | −24.89 | 0.34 | 15.41 | 8.92* | 29 | 4.0 | 20.4 | 2.0 |
| NGC 1407 | −24.00 | 0.90 | 19.09 | −25.09 | 0.61 | 16.54 | 8.96* | 29 | 4.2 | 21.7 | 8.8 |
| NGC 1419f | −20.00 | 0.02 | 18.69 | −21.61 | −0.46 | 13.80 | 8.95*b | 30 | 3.8 | ... | 0.2 |
| NGC 1427 | −22.42 | 0.65 | 19.41 | −23.56 | 0.25 | 16.29 | 8.73*b | 26 | 4.0 | ... | 1.8 |
| NGC 2974f | −22.77 | 0.67 | 19.15 | −24.18 | 0.30 | 15.70 | 9.27* | 26 | 5.1 | 20.9 | 4.2 |
| NGC 3377 | −21.11 | 0.34 | 19.18 | −22.79 | 0.02 | 15.93 | 8.15* | 32 | 3.1 | ... | 0.6 |
| NGC 3379 | −22.29 | 0.41 | 18.36 | −23.88 | 0.18 | 15.59 | 8.61* | 31 | 5.2 | 21.5 | 1.2 |
| NGC 4365 | −22.99 | 0.73 | 19.22 | −24.91 | 0.57 | 16.07 | 8.77* | 26 | 4.2 | ... | 4.3 |
| NGC 4472 | −23.47 | 0.69 | 18.56 | −25.79 | 0.74 | 16.52 | 8.62* | 37 | 3.0 | 21.7j | 4.9 |
| NGC 4486 | −23.45 | 0.68 | 18.54 | −25.55 | 0.80 | 17.02 | 9.14* | 45 | 3.0 | 24.9j | 8.7 |
| NGC 5128 | ... | ... | ... | −23.87 | 0.19 | 15.64 | 10.23 | 33 | 5.4 | ... | ... |
| NGC 5812g | −22.79 | 0.72 | 19.38 | −24.08 | 0.25 | 15.52 | 9.18*b | 28 | 4.6 | ... | 4.5 |
| NGC 7619 | −24.11 | 1.06 | 19.78 | −25.67 | 0.64 | 16.14 | 9.66* | 24 | 5.4 | 21.7j | 14.0 |
| NGC 7626 | ... | ... | ... | −25.47 | 0.79 | 17.05 | 9.59*b | 25 | 5.3 | 23.3j | ... |
Notes. Note about spatial scales: Data from NVSS and Condon et al. (2002) were obtained using the D-Configuration which corresponds to a beamsize of θ ∼ 45''. Data from other sources were obtained in different configurations yielding higher resolutions. The integrated flux used to compute L1.4GHz were taken from the central regions of the resolved galaxy and correspond to the following metric sizes: NGC 1614 ∼0.62 × 0.65 kpc; AM 0612–373 ∼ 8.1 × 8.1 kpc; NGC 2623 ∼ 0.35 × 0.35 kpc; NGC 3256 ∼ 0.05 × 0.05 kpc; NGC 4194 ∼ 0.64 × 0.48 kpc; NGC 5018 ∼ 0.18 × 0.18 kpc; Arp 193 ∼ 1.0 × 0.4 kpc; IC 5298 ∼ 0.74 × 0.69 kpc. *=upper limits in one or more IRAS bands used to derive LIR; 1.49 GHz flux measurement source from NVSS (Condon et al. 1998) unless otherwise noted. aLIR as defined in Sanders & Mirabel (1996) assuming H○ = 75 km s −1 Mpc −1, and IRAS fluxes from Sanders et al. (2003) unless otherwise noted. bNASA/IPAC Scan Processing and Integration tool. cKnapp et al. (1989) and 1994 correction from Centre de Donnees astronomiques de Strasbourg. dWFPC2 FOV is smaller than the actual size of the galaxy, summation of circular apertures likely to underestimate MI. eIRAS Point Source Catalog. fK-band photometry from 2MASS. gPhotometry from Paper II. hCondon et al. (1990). i3σ rms upper limits Smith & Kassim (1993). jCondon et al. (2002). kCondon (1987). lMoellenhoff et al. (1992).
Download table as: ASCIITypeset image
I-band and K-band photometry for the comparison sample of ellipticals are also given in Table 7. Published I-band photometry for 19 of the 23 of the comparison sample of ellipticals was taken from Blakeslee et al. (2001). This is a combination of data from two early-type galaxy surveys, Surface Brightness Fluctuation (SBF) Survey of Galaxy Distances (Tonry et al. 1997) and the Streaming Motions of Abell Clusters (SMAC) project (Smith et al. 2001). Since the SMAC project standardizes all observations to R band, the photometry was published as R band, even though the observations were conducted at V band and I band. The published photometry was transformed back to the original Cousins I band using the color equation given in Blakeslee et al. (2001). The I-band parameters were measured using a Sersic profile fit to circular annuli. The Sersic profile is r1/n, where n = 4 is the de Vaucouleurs profile and n = 1 is an exponential disk. Kelson et al. (2000) tested a comparison between de Vaucouleurs and Sersic profiles for the SBF sample and found a negligible difference in the derived parameters Reff and 〈μI〉eff. The K-band data in Table 7 come primarily from P99. In that paper, de Vaucouleurs profiles were fitted to circular isophotes. As noted earlier, 2MASS K-band data were obtained for four elliptical galaxies, and another were observed along with the merger remnants. The parameters MK, Reff, and 〈μK〉eff were derived using the same techniques as the K-band data for the merger remnants. MK was measured by summing the flux in circular isophotes to the edge of the array and Reff and 〈μK〉eff were derived using de Vaucouleurs fits to circular isophotes. It must be noted that circular isophotes were selected to measure the Reff and 〈μ〉eff in both I and K bands in order to remain consistent with previously published work for elliptical galaxies and the FP.
4.2.1. IRAS Fluxes
Column 8 in Table 7 shows the computed values of log LIR for the merger remnants and the comparison sample of ellipticals. LIR is defined as the total flux from 8–1000 μm (see Table 1; Sanders & Mirabel 1996) using the four IRAS passbands (12, 25, 60, and 100 μm). In cases where there is no detection in one or more IRAS bands, the 3σ rms is used for computing LIR. The sources for the fluxes are listed in Table 7.
4.3. Surface Brightness Profiles
I-band surface brightness profiles in elliptical isophotes were measured for nine merger remnants to compare with previously published K-band surface brightness profiles. The profiles were measured using elliptical isophotes in order to determine the structural parameters ellipticity ( ), P.A., and a4/a, which is the amplitude of the 4 cos θ term that measures the deviation of the isophote in relation to a perfect ellipse. The semimajor axis of each isophote was increased in linear steps, and foreground stars, CRs and chip artifacts were masked just as in the measurement of circular isophotes. The usable area in pixels, the total summed flux, , P.A., and B4 values were taken from ELLIPSE and used to construct the profiles. The B4 parameter is the 4 cos θ measured relative to the equivalent radius. This was converted to the more widely used a4/a (Bender et al. 1988, 1989), which is taken relative to the semimajor axis (Milvang-Jensen & Jørgensen 1999).
4.4. Central Aperture Photometry
Aperture photometry was performed on the I-, J-, H-, and K-band images of the merger remnants corresponding to a size of 1.53 h−1 kpc in diameter. This aperture size was chosen to match the aperture used to measure σ○. The smallest aperture size for AM 2055 − 425 was limited by the seeing in K band to 1.7 h−1 kpc. The photometry was performed using the APPHOT task in IRAF. The galaxy centers were chosen based on the K-band data. The I-band aperture photometry was performed on the HST/ACS or HST/WFPC2 PC data which were convolved to the seeing and resolution of the K-band QUIRC images. Tests comparing photometry on unconvolved and convolved ACS/WFC and WFPC2 data showed no difference in results.
In order to maintain consistency in the filters, all near-IR observations were transformed to the MKO system. 2MASS J- and H-band photometry was transformed to the MKO system using the transformations given in Hodgkin et al. (2009). Observations of IC 5298 were made using an older filter system and were also transformed to the MKO system via the NSFCAM Web site (the older QUIRC filters matched the older NSFCAM filters).
5. RESULTS
5.1. The σ-discrepancy
The driving observational question is to ascertain whether the σ-discrepancy first discovered in RJ06a is connected with the galaxy type or a problem for all galaxies when using either the CaT or CO stellar lines to measure σ○. Once the scope of the σ-discrepancy is quantified, the underlying causes can be investigated. The original discovery was limited to a comparison of σ○ of predominantly LIRG galaxies that were clustered together and offset from the K-band FP. These were measured with K-band photometry and σ○ measured using predominantly CaT spectra. SG03 had noted a similar optical/near-IR σ○ discrepancy for early-type (predominantly S0) galaxies, and concluded the cause to be the sensitivity of different wavelengths to the hot and cold stellar components in S0 galaxies, mixed with the effects of dust. The GNIRS CO observations presented in this paper focus on kinematic measurements of non-LIRG merger remnants found to lie on the FP in RJ06a (based on CaT observations). The non-LIRG subsample and comparison ellipticals represent "control" samples which are used to test whether the σ-discrepancy is a widespread phenomenon, or limited to certain galaxy populations. Unfortunately, there are no ULIRGs with published optical and IR σ○ to further test the mismatch in merger remnants.
5.1.1. Central Velocity Dispersions
Figure 1 shows a comparison between optical (CaT) and near-IR (CO) σ○ for a larger sample of merger remnants than in RJ06a, including LIRGS (left) and non-LIRGs (center). The overplotted dashed line represents unity (σ○,optical = σ○,IR). The figure includes merger remnants which were found to lie on or very close to the FP in RJ06a. Figure 1 also includes a sample of 23 elliptical galaxies (right) to test whether they show any indications of a discrepancy similar to those seen in SG03. The optical velocity dispersions (σ○,optical) of the comparison sample of ellipticals come from both the CaT and the Mg Ib line (λ ∼ 5200 Å). Table 6 notes which absorption lines are used for each elliptical galaxy. Dressler (1984) and Barth et al. (2002) compared the two different absorption features and found σ○ matched within the errors. Major differences arose only when there was evidence of star formation in the Mg Ib region.
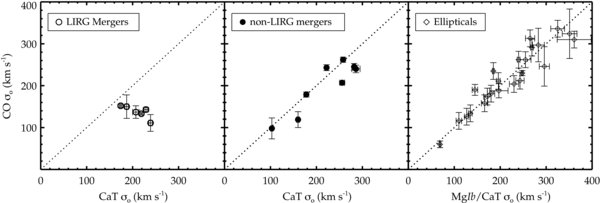
Figure 1. Comparison of optical (CaT) and near-IR (CO 2.29 μm) σ○ among six LIRG merger remnants (left, open circles), eight non-LIRG merger remnants (center, filled circles), and 23 elliptical galaxies (right, open diamonds). The optical σ○ include both Mg Ib and CaT σ○ for the ellipticals. The overplotted diagonal dashed line indicates a value of unity between optical and near-IR σ○.
Download figure:
Standard image High-resolution imageEvery attempt was made to remove as many systematics as possible which might cause differences between the optical and IR σ○ for the merger remnants. All of the optical and near-IR observations (2/6 LIRGs, 6/8 non-LIRGs) used the same P.A. for the slit. The slit widths in the dispersion direction were similar (05, 0432, 03 for ESI, NIRSPEC, and GNIRS, respectively). The same 19 template stars were used to derive σ○ and the extraction aperture (spatial axis) remained the same for all observations. The σ○ obtained from the literature were corrected to a common aperture size as noted in Section 4.1.1. Unfortunately, the P.A.s most of observations from the literature were not published. The one published P.A. is for AM 2055 − 425, which was −45° compared with −35° used for the CaT observations.
If the optical and infrared are probing the same stellar populations and the same mass profiles, then the slope should be unity, within the observational errors. A double weighted least-squares (dwlsq) fit (Press et al. 1992) has been made to the data to compare with a slope of unity. This method of fitting the data is required because there is no true independent variable. A simple least-squares fit or any variation which assumes independent and dependent variable will not produce a meaningful result, as there is no implied causation between one σ○ and the other (see Feigelson & Babu 1992 for a detailed discussion). The only underlying assumption is that the slope should be unity if σ○ for each stellar line is measuring the same thing. Measurement errors for each variable must be taken into account. The dwlsq fits for the data in each panel (left to right) are
The above fits indicate that for elliptical galaxies, σ○ measured at optical and near-IR wavelengths produce virtually the same result over a wide range of luminosities. Moreover, with the exception of NGC 5812, these observations were made with varying P.A.s and different templates. The LIRGs show a very poor fit, while the non-LIRGs show a smaller, but statistically significant offset from unity. These results strongly suggest that the σ-discrepancy is related to the galaxy type. The result for "pure" elliptical galaxies is important because it confirms what SG03 argued, namely, that the S0's in their sample were the dominant cause for the discrepancy between σ○,optical and σ○,CO. The result also confirms more rigorously for the first time, that optical and near-IR σ○ probe the same dynamics in elliptical galaxies, and can be used interchangeably.
5.1.2. Spatial Kinematics of non-LIRG Merger Remnants
Cox et al. (2006) used numerical simulations to study the kinematic structure of gas-rich, equal mass merger remnants. The simulations included a treatment for radiative cooling, star formation, and feedback from supernovae. Their results showed that the youngest populations had the largest rotation, thus making it possible to identify different aged populations based on V(r). If the CaT and CO are tracking two distinct stellar populations, then their V(r)'s should differ significantly, if they are tracking the same population, then they should match. The deep GNIRS observations allow, for the first time, such a comparison to be made in merger remnants. Figures 2 and 3 show a comparison between CaT and CO derived V(r)'s (Figure 2) and σ as a function of radius (Figure 3) for six non-LIRG merger remnants observed with GNIRS. The filled circles in both figures represent CaT measurements, the open circles in both figures represent CO measurements. The dotted vertical lines in each panel, taken together, represent the width of the 1.53 h−1 kpc diameter aperture used to extract σ○. A qualitative comparison between the CaT and CO measurements in Figures 2 and 3 suggests that for most of the merger remnants, the CaT and CO track each other closely. The non-LIRG merger remnants show very similar V(r) and σ(r).
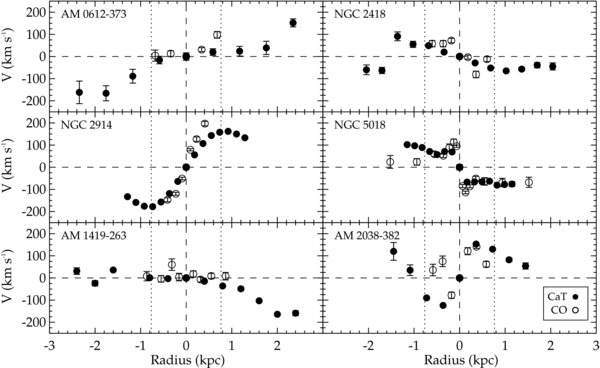
Figure 2. Comparison between rotation curves measured from CaT (filled circles) and CO observations (open circles) for six non-LIRG merger remnants originally found to lie on the FP in RJ06a. The horizontal dashed line indicates zero rotation, the heavier vertical dashed line indicated the center of the galaxy. The dotted vertical lines taken together represent the width of the 1.53 h−1 kpc central diameter used to measure σ○. Each point includes errors derived from the fitting routine.
Download figure:
Standard image High-resolution image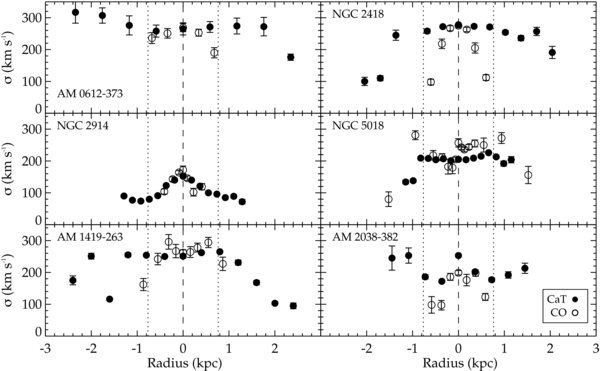
Figure 3. Comparison between σ(r) measured from CaT (filled circles) and CO observations (open circles) for six non-LIRG merger remnants originally found to lie on the FP in RJ06a. The heavier vertical dashed line indicated the center of the galaxy. The dotted vertical lines taken together represent the width of the 1.53 h−1 kpc central diameter used to measure σ○. Each point includes errors derived from the fitting routine.
Download figure:
Standard image High-resolution imageA more quantitative comparison between the CaT and CO measurements was made. A Kuiper two-tailed test was used to quantitatively compare the distributions of the CaT and CO measurements. It is a modified version of the two-tailed Kolmogorov–Smirnov (K–S) test developed by N. H. Kuiper which is sensitive to changes at the tail ends of the distribution (Kuiper 1962; Press et al. 1992). Like the K–S test, the Kuiper test probes the null hypothesis that the two distributions in question arise from the same population. It is a non-parametric test that makes no assumptions about the form of the parent distribution. The only assumption is that the two distributions are continuous. While, the K–S test is useful for detecting shifts in the probability distribution, it has difficulty detecting spreads in the distribution. Such spreads are most noticeable at the tails of the distribution (Press et al. 1992). Both the K–S and Kuiper two-tailed tests require that each distribution have a minimum of four valid data points. The test is used to determine whether the null hypothesis can be rejected within specific confidence levels (Stephens 1970, 1974). In this case, the null hypothesis is that the CaT and CO V(r) and σ(r) match over the same spatial radius for each merger remnant. With one exception (σ(r) in NGC 5018 at the 0.025 confidence level), the null hypothesis could not be rejected in any galaxy for either V(r) or σ(r).
5.1.3. Is the σ-discrepancy Correlated with LIR?
The left panel in Figure 1 clearly demonstrates a σ-discrepancy in LIRGs, while in the center panel, the non-LIRGs show a slight discrepancy. To explore this result further, a new parameter, σfrac, is defined and will be used for the remainder of the paper:
where σOptical = σCaT for the merger remnants. Figure 4 is a plot of LIR versus σfrac for all of the merger remnants (left) and the comparison sample of ellipticals (right). The symbols in Figure 4 are the same as in Figure 1. The dotted horizontal line in both panels represents σfrac = 0. The dashed diagonal line in the left panel of Figure 4 represents a least-squares fit to the data. In order to test for the presence of a correlation between LIR and σfrac for the mergers and ellipticals, a Pearson Correlation Test was used. This tests the degree of linear correlation between two sets, ranging from r = −1 to +1, (perfect negative or anti-correlation to perfect positive correlation). The results show a correlation coefficient of r = 0.77 for the merger remnants, and r = 0.06 for the ellipticals. Of course, correlation does not equal causation, but it may point at important physical processes which drive the mismatch. A least-squares fit to the data for merger remnants yields

This provides a method to predict the approximate σ-discrepancy in other LIRGs and ULIRGs.
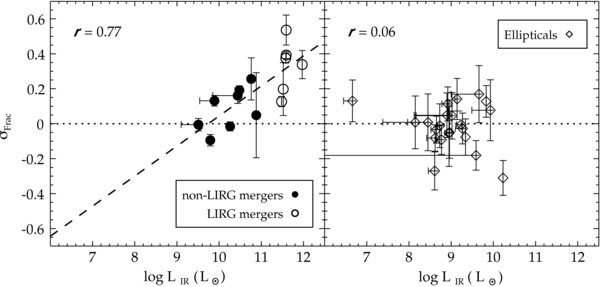
Figure 4. Two panel figure showing the correlation between LIR and σfrac for merger remnants (left) and the lack of correlation for elliptical galaxies (right). The symbols are the same as Figure 1. The horizontal dotted line represents σfrac = 0, and the overplotted dashed line is a least-squares fit to the merger remnants. The vertical error bars are the σfrac errors. The horizontal bars plotted for some galaxies represent the upper and lower limits of LIR in cases where one or more IRAS bands are not detected. The diagonal dashed line in the left panel of Figure 4 represents a least-squares fit to the value for the merger remnants. The Pearson Correlation Coefficient is noted in both panels.
Download figure:
Standard image High-resolution image5.1.4. Correlation of σfrac With Dust Mass and 1.4 GHz Radio Luminosity
SG03 compared the dust masses of their sample of early-type galaxies with the differences in optical and near-IR σ, to test whether the presence of dust was correlated with the differences in σ. While they were unable to find any correlation, they did postulate that the presence of dust around the cold stellar component in S0 galaxies may shield the disk component from detection at optical wavelengths. Figure 5 (top) shows a comparison between σfrac and the estimated dust mass (Mdust) for the sample of merger remnants (top, left) and elliptical galaxies (top, right). The symbols are the same as in Figure 1. The dust masses were computed using the approximation given in Hildebrand (1983) and Thuan & Sauvage (1992):
where S60 and S100 are the IRAS flux densities at 60 and 100 μm in Jy, respectively, and D is the distance in Mpc. This equation assumes the far infrared emission originates from dust with an emissivity law ∝ λ−1 at λ ⩽ 200 μm and a temperature derived from the 60 and 100 μm IRAS color, Td, given by Sauvage (1997):
However, Goudfrooij & de Jong (1995) noted that there is likely a contribution from hot circumstellar dust to the 60 and 100 μm flux from Mira type stars. The corrections to the 60 and 100 μm flux densities are


where S12 is the 12 μm IRAS flux density. In cases where there is no detection in one or more IRAS bands, the 3σ rms is used as an upper limit and plotted as such in Figure 5 (top). The diagonal dashed line plotted in Figure 5 (top, left) is a least-squares fit to the data:

Table 7 lists the computed Td and Mdust for the merger remnants and elliptical galaxies. Thuan & Sauvage (1992) and Sauvage (1997) warn that IRAS is mainly sensitive to dust in the temperature range 25–30 K. Md will be underestimated if there is a substantial cold dust component (T ∼ 10 K). The elliptical galaxies show practically no correlation. The computed values in Table 7 are presented to give an approximation for the dust temperatures and masses, and are far from absolute. Figure 5 (top, left) shows a moderately strong correlation between Mdust and σfrac for the merger remnants.

Figure 5. Comparison between σfrac and dust masses (log MDust) in the merger remnants (top, left) and elliptical galaxies (top, right) and σfrac and 1.49 GHz radio luminosity in merger remnants (bottom, left) and elliptical galaxies (bottom, right). The dashed lines in the left panels are the least-squares fit to the data. Also shown is the Pearson correlation coefficient in each panel. The symbols are the same as Figure 1. The vertical dotted line in the bottom panels is log L1.4 GHz = 22 W Hz−1, which marks the transition between radio quiet and radio loud in galaxies at 1.4 GHz.
Download figure:
Standard image High-resolution imageFigure 5 also shows a comparison between the 1.49 GHz (20 cm) continuum flux densities and σfrac for the merger remnants (bottom, left) and ellipticals (bottom, right). The 1.49 GHz luminosities are computed using the relation from Yun et al. (2001).
where D is the distance in Mpc and S is the flux density in Jy. The computed luminosities are listed in Table 7. Yun et al. (2001) demonstrated a linear correlation between the 60 μm luminosity and 1.49 GHz radio luminosity of slope nearly unity. Using data from the IRAS 2 Jy Survey (Strauss et al. 1990, 1992; Fisher et al. 1995) and the NRAO VLA Sky Survey (NVSS; Condon et al. 1998), they derived a method for estimating the SFR from 1.49 GHz flux measurements. Thus, the 1.49 GHz flux can also be used as a proxy for detecting the presence of strong star formation in galaxies with large amounts of dust. The 1.49 GHz flux is most sensitive to stellar populations t < 108 yr (see Condon (1992) for a more detailed review). The computed luminosities in Table 7 are based on measurements from the NVSS or higher resolution surveys for the merger remnants (Condon 1987; Condon et al. 1990; Moellenhoff et al. 1992; Smith & Kassim 1993). Where possible, the higher resolution data are used in Table 7 as noted. The integrated fluxes used to compute L1.4 GHz for most of the merger remnants were taken from the central regions of the resolved galaxies. The dashed diagonal line in the bottom, left panel is the least-squares fit to the points, given by

Also shown in each panel of Figure 5 is the Pearson correlation coefficient, which indicates a strong correlation between L1.49 GHz and σfrac. The ellipticals show no correlation.
5.2. Dynamical Differences as a Function of Wavelength
The σ-discrepancy is associated with IR-bright, gas-rich, star-forming galaxies. As a result, observations of the stellar component of gas-rich mergers must contend with the presence of two stellar populations, the old, late-type stars (predominantly K and M giants) formed prior to the merger in the progenitor galaxies, and the young burst population formed as a result of the merger. It is not unreasonable to suggest that both components make a contribution to the dynamical properties of the system and that the optical and near-IR diagnostics used to measure dynamics probe these populations differently in merger remnants. This was first hinted at in RJ06a. In this section, the I-band and K-band dynamical diagnostics are compared with each other. This directly addresses the discrepancies among previous photometric and kinematic studies, which have measured these properties in differing spectral bands in mergers.
5.2.1. The Fundamental Plane
Figure 6 is a two panel figure which shows the I-band FP from Scodeggio et al. (1997; dotted line left panel) and the K-band FP from Pahre et al. (1998b; dotted line right panel). The I-band FP has been corrected to H○ = 75 km s−1 Mpc−1. Overplotted in both panels are LIRG merger remnants (open circles), non-LIRG merger remnants (filled circles), and the comparison sample of ellipticals (open diamonds). Due to the limitations of available I-band data, the same merger remnants and ellipticals do not appear in both panels. All LIRGs, 20/23 ellipticals, and 3 non-LIRG merger remnants (NGC 4194, NGC 5018, NGC 7252) are overplotted on the I-band FP. The left panel in Figure 6 presents the position of merger remnants on the I-band FP for the first time.

Figure 6. Two panel figure showing the pure I-band (left) and pure K-band (right) fundamental plane. The diagonal dashed line in both panels indicates the best-fit fundamental plane from Scodeggio et al. (1997; I band) and Pahre et al. (1998b; K band). The symbols are the same as Figure 1.
Download figure:
Standard image High-resolution imageQualitatively, the difference between the location of LIRGs on the I- and K-band FPs is striking. The LIRGs show virtually no offset from the I-band FP and have a dynamic range similar to that of the elliptical galaxies. Yet in the K band, the LIRGs are clustered together and offset from the FP. Most non-LIRGs show less deviation from the FP in both panels, with the exception of two remnants (NGC 4194 and NGC 7252) on the K-band FP.
Quantitatively, the mean of the residuals (ΔFP), or average offset, of the LIRG merger remnants from the I-band FP is −0.05 dex, compared with −0.58 dex for the K-band FP. The non-LIRGs have an average offset of 0.02 dex in the I band and −0.28 dex in the K band. Excluding the two outliers, NGC 4194 and NGC 7252 in the K band, reduces this to −0.17 dex. These two merger remnants have the brightest LIR of the non-LIRGs. For comparison, the average offsets of the ellipticals from the I-band and K-band FP are −0.004 and −0.07 dex, respectively. Figure 7 plots the I-band (top) and K-band (bottom) FP residuals (ΔFP) against LIR for the merger remnants (left) and elliptical galaxies (right). The Pearson correlation coefficient was used to test whether a relation exists in any of the four panels. The only strong correlation is an anti-correlation between the K-band ΔFP and the LIR of the merger remnants. The more IR-luminous the merger remnant, the larger the offset from the FP. A least-squares fit to the data yields
The best-fit line is shown in Figure 7 (dashed line in bottom left panel). This fit should provide an estimate of the offset of a LIRG/ULIRG from the K-band FP for objects lacking kinematic or photometric observations. The effect is not seen in ellipticals at either wavelength nor in merger remnants in the I band. The negligible anti-correlation seen in the I-band panels is driven by one point in both plots.
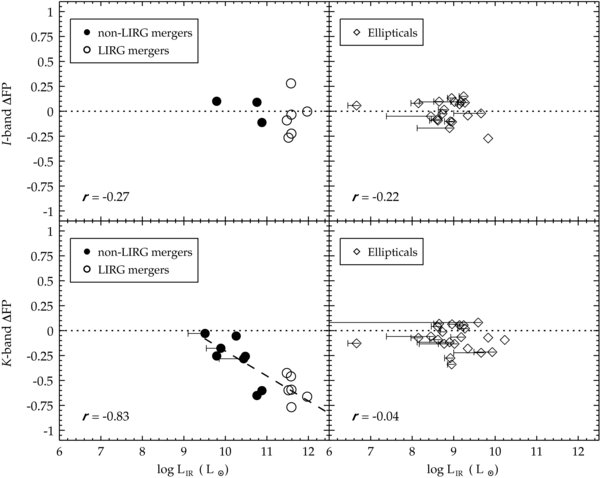
Figure 7. Four panel figure comparing the FP residuals (ΔFP) with LIR for merger remnants (left) and elliptical galaxies (right) in the I band (top) and K band (bottom). The symbols are the same as Figure 1. The Pearson Correlation Coefficients are noted in each panel. The dashed line plotted in the bottom left is a least-squares fit to the data.
Download figure:
Standard image High-resolution imageFigure 8 presents the FP in a different projection, separating the photometric and kinematic observables. The top panel is the I-band FP and the bottom panel is the K-band FP. The symbols are the same as in Figure 1. The advantage of this projection is that it directly compares the distribution of optical and infrared σ○ along the x-axis. Again, this shows the clustering of the LIRGs in the K band, while at I band, the merger remnants show a dynamic range similar to that of the elliptical galaxies along the FP. Moreover, the "pure" I-band and K-band FP presentations of the properties of the merger remnants in Figures 6 and 8 explain the apparent contradiction between the results in RJ06a and earlier IR studies. The properties of the merger remnants plotted on the K-band FP in RJ06a are a "hybrid" of K-band photometry and optical σ○. In the case of elliptical galaxies, combining optical σ○ and K-band photometric properties makes little difference, but for IR-bright merger remnants, the differences are significant.
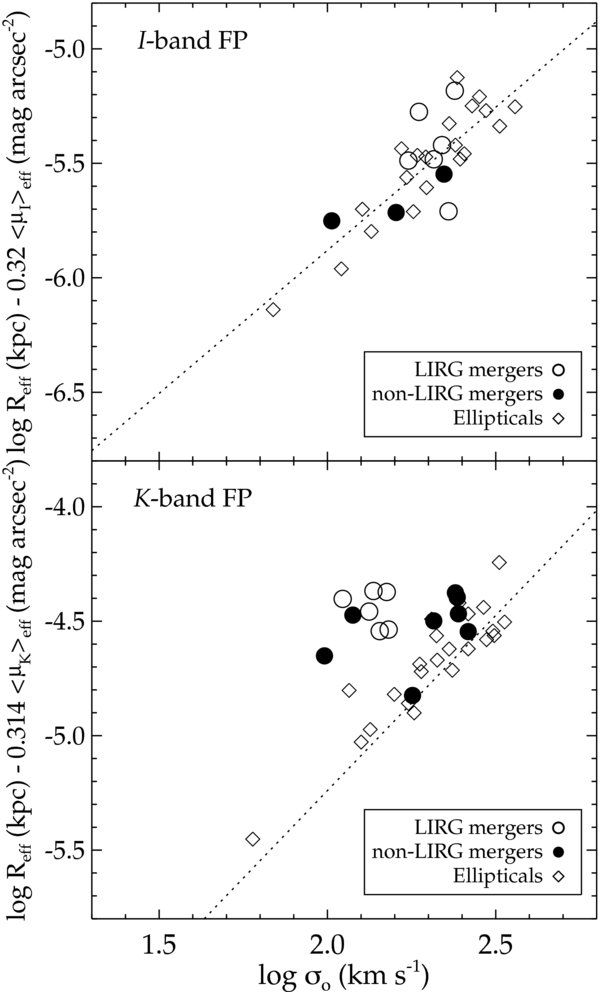
Figure 8. Two panel figure showing the fundamental plane projected so that the photometric and spectroscopic observables are separated. The symbols and dotted line are the same as Figure 1.
Download figure:
Standard image High-resolution image5.2.2. Dynamical Masses and the Effects of Stellar Populations
The results presented in the previous section suggest that the distributions of both mass and luminosity of (primarily) LIRG merger remnants derived from K-band observations are different when compared with those of elliptical galaxies, yet are similar to those of elliptical galaxies when derived from I-band observations. While the presence of young stellar populations has been known for some time to affect the observed luminosities of merger remnants in the near-IR, they also influence the kinematic properties measured in the near-IR. Figure 9 shows a comparison between M and M/L in the I band (left) and K band (right) for the merger remnants and elliptical galaxies. The symbols are the same as in Figure 1. The vertical dotted line in both panels indicates the mass of an m* galaxy. The masses shown in Figure 9 are total virial Mdyn of each galaxy calculated using
(Proveda 1958; Fish 1964; Rood et al. 1972; Tonry & Davis 1981; Binney 1982; Bacon et al. 1985; Richstone & Tremaine 1986; Mathews 1988; Bender et al. 1989), where reff is from a de Vaucouleurs profile fit and G is the gravitational constant. The constant κ used is 6.0 (Michard 1980), rather than the canonical 9.0, which assumes σ does not vary over the galaxy. Michard (1980) showed that κ actually varies as a function of geometry, inclination, observational factors, and rotational component. Taking into account the use of σ○ and the spread of such values in elliptical galaxies, Michard (1980) concluded that a value of κ = 6.0 is most appropriate. The total L in the I and K bands are extrapolated using 〈μ〉eff and assuming a de Vaucouleurs profile. Thus, the total light is 2π 〈Ieff〉 Reff2 (Binney & Merrifield 1998; Milvang-Jensen & Jørgensen 1999). Neither is corrected for extinction.
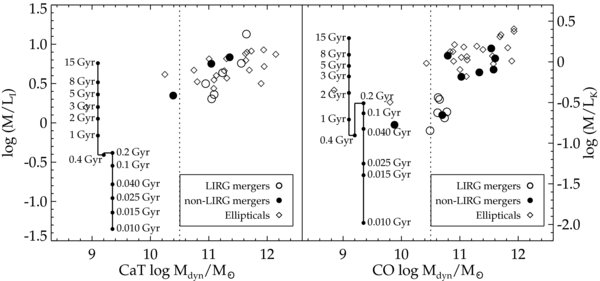
Figure 9. Two panel figure showing pure I-band (left) and pure K-band (right) M/L vs. Mdyn. The overplotted vector in each panel is the evolution of M/L for a single-burst stellar population with solar metallicity and a Salpeter IMF as computed from Maraston (2005). The horizontal placement of the M/L vector is for display only. The symbols are the same as Figure 1.
Download figure:
Standard image High-resolution imageIn the I band, the Mdyn of the merger remnants span nearly the same range as the elliptical galaxies. Almost all of the mergers have masses ∼ several-m*, while at K band there is a clear bifurcation between LIRGs and non-LIRGs, with the exception (again) of NGC 4194 and NGC 7252, which have the brightest LIR of the non-LIRGs. The LIRGs straddle the m* line in the K-band panel, while the non-LIRGs overlap with the elliptical galaxies. A Kuiper two-tailed test was used to test whether the distributions of the properties of the merger remnants and elliptical galaxies are similar. The null hypotheses tested in this section are that the I-band and K-band properties (M/L and Mdyn) of the merger remnants and elliptical galaxies come from the same population. In the I band, the null hypothesis cannot be rejected for any comparison between LIRG or non-LIRG merger remnants and the elliptical galaxies. In the K band, the null hypothesis cannot be rejected when comparing the properties of non-LIRG merger remnants to elliptical galaxies. However, in the K band, the null hypothesis can be rejected at the 0.01 confidence level for LIRG and elliptical Mdyn and at the 0.15 confidence level for LIRG and elliptical M/L.
Figure 9 also compares the evolution of M/L at I band and K band for a single-burst population using the stellar population models from Maraston (2005, hereafter M05). A single-burst model was selected based on numerical simulations of Mihos & Hernquist (1996) and because the sample selection criterion of a single (coalesced) nucleus indicates that the major burst has already occurred or is ongoing. Gas-rich mergers may undergo smaller bursts due to earlier tidal passages and interactions, but the spiral response of the disks to interactions is not very effective at driving gas to the center. It is during the final coalescence that the bulk of the gas is funneled to the barycenter of the merger, producing a peak in the SFR 1–2 orders of magnitude more than the pre-interaction rate over a timescale of ∼50 Myr.
The vector in each panel includes the age of the population at a given M/L. The vectors reflect changes only in M/L, not mass, and their positions in Figure 9 do not reflect any information about mass. The "twists" present in both (but strongest at K band) reflect real double values in M/L at certain ages. The model shown assumes solar metallicity and a Salpeter initial mass function (IMF). Changing from solar to either half or twice solar metallicity causes only a slight shift (<0.1 dex) up or down in M/L at both wavelengths. Using a Kroupa IMF shifts the M/L vector down by 0.3 dex and shrinks the "twist" slightly in the K-band vector at t ∼ 0.2–0.4 Gyr.
Stellar population models from M05 were selected due to the starburst nature of merger remnants. The models in M05 are particularly sensitive to the presence of RSGs and thermally pulsing AGB (TP-AGB) stars. These populations contribute significantly (as much as 90% depending on metallicity) to the total near-IR luminosities of the starburst. The models include the presence of important molecular bands such as CN, TiO, C2, H2O in addition to the CO band heads. The presence of these bands can significantly affect M/L, colors, inferred stellar masses and ages. While the M05 models are not perfect in their ability to reproduce observed stellar populations, careful comparisons show them to provide significantly better matches than other available models in the near-IR for young populations.
The models reveal that in the I-band the M/L's of the merger remnants (both LIRG and non-LIRG) are dominated by stellar populations older than 5 Gyr. As noted above, they are statistically indistinguishable from the M/L of the elliptical galaxies. In the K-band, the same bi-modal distribution of the merger remnants seen in the FP figures appears here. The LIRGs (along with NGC 4194 and NGC 7252) have M/L consistent with a young starburst population (40–200 Myr) or an AGB/post-starburst population (400 Myr–1.5 Gyr). Because the luminosities have not been corrected for extinction, the age estimates should be viewed as qualitative comparisons only. More sophisticated age-dating of the stellar populations using a combination of stellar absorption and nebular emission lines will be presented in Paper II.
Figure 10 compares the M/L in I band (left) and K band (right) with σfrac for the merger remnants (top) and elliptical galaxies (bottom). The symbols are the same as in Figure 1. In this figure, the σ-discrepancy is compared with M/L to test for a correlation using the Pearson correlation coefficient. No correlation exists for the elliptical galaxies at either wavelength. In the I band the LIRGs and non-LIRG remnants show no correlation. At K band, the merger remnants show a strong anti-correlation between M/LK and σfrac. Separating the two merger remnant populations gives a Pearson coefficient of −0.38 (moderate) for the non-LIRG merger remnants and −0.70 (strong) for the LIRGs. The dashed line in the upper left panel is the least-squares fit to that data:
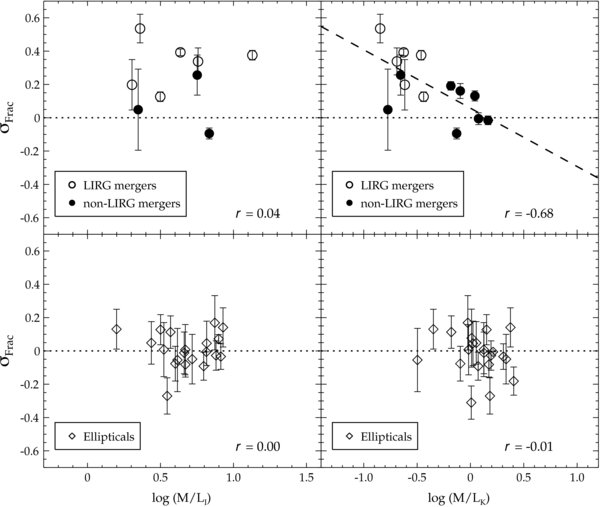
Figure 10. Comparison between σfrac and M/L in the I band (left) and K band (right) for the merger remnants (top) and elliptical galaxies (bottom). The diagonal dashed line overplotted in the top right panel shows a least-squares fit to the K-band M/L and σfrac. The symbols are the same as Figure 1. The Pearson correlation coefficient is given for the data in each panel.
Download figure:
Standard image High-resolution image5.2.3. Surface Brightness Profiles
Figure 11 shows a comparison between the I-band and K-band surface brightness profiles of nine merger remnants from the sample: six are LIRGs and three are non-LIRGs. The profiles in Figure 11 were measured using elliptical isophotes, holding only the position of the nucleus fixed, allowing all other parameters to vary. The filled circles are the new I-band HST data, the open circles are K-band data first published in RJ04. Overplotted on each point are the 1σ errors. The data are plotted as a function of radius1/4. The straight dashed diagonal lines are the de Vaucouleurs r1/4 fits to the profiles. RJ04 established for the remnants shown in Figure 11 that their K-band profiles were well characterized by a de Vaucouleurs light profile. The I-band profiles are also well characterized by a de Vaucouleurs profile. The facts that both the non-LIRG and LIRG merger remnants follow r1/4 profiles over large dynamic ranges and large spatial scales (well beyond 10 kpc in radius) in both the I and K bands and show evidence of strong tidal tails and shells, demonstrates that these objects are the products of major mergers (i.e., progenitor mass ratios between 1:1 and 4:1).

Figure 11. Surface brightness profiles in I band (filled circles) and K band (open circles). 1σ standard errors are overplotted on each point. The surface brightness profiles in each filter are measured out to an S/N = 3 over the background (noise + sky). The I-band profiles are from HST ACS/WFC or WFPC2 observations, the K-band profiles are from UH 2.2 m QUIRC observations. All profiles are measured using elliptical apertures. The light dashed line in each plot represents the best-fit de Vaucouleurs r1/4 fit to all of the data.
Download figure:
Standard image High-resolution imageThe profiles of NGC 2623, Arp 193, AM 2055 − 425, and IC 5298 show a divergence between the I band and K band at radii ⩽ 1 kpc. The I- and K-band profiles of NGC 4194 and NGC 7252 run more or less parallel and are well fitted by an r1/4 profile. NGC 7252 shows some evidence of an upturn or "excess light" in the I-band light profile at small radii, similar to the K-band discovery for other merger remnants in RJ04. However, the K-band data for NGC 7252 do not probe as far inward as the I-band data, so it may be possible that the K band shows the same or stronger upturn. However, at large radii, the I and K profiles are nearly parallel. NGC 5018 has nearly parallel I-band and K-band profiles. The results from NGC 1614 and NGC 3256 are less clear, but the latter does show a significant divergence beginning at r ∼ 2 kpc, and narrowing at smaller radii.
Another way to characterize the merger remnants is to compare the structural parameters in the I and K bands. The parameters a4/a, , and P.A. are measured for each isophote as a function of linear radius, is shown in Figure 12 for the nine remnants. Overall the I-band and K-band structural parameters are very different from each other. With the exception of NGC 5018, the I band shows large variations in a4/a, but very little variations in and P.A., whereas the K band shows evidence of twisty isophotes and large variations in ellipticity. The K-band shapes appear to be predominantly disky in the central regions (positive a4/a). NGC 5018 shows little or no variation for a4/a and P.A., however, does show a discrepancy within the central 1 kpc, and then a slight discrepancy at r > 10 kpc. NGC 7252 shows little variation between the I band and K band for the a4/a and parameters, but the P.A.'s are very different. Figure 12 may indicate some structural evolution. NGC 5018 and NGC 7252 are the most advanced merger remnants shown; the latter is the last merger in the Toomre Sequence (Toomre 1977). These two merger remnants show less deviation between their I- and K-band structural parameters than the other merger remnants, consistent with their being in a transitional stage between mergers and ellipticals.
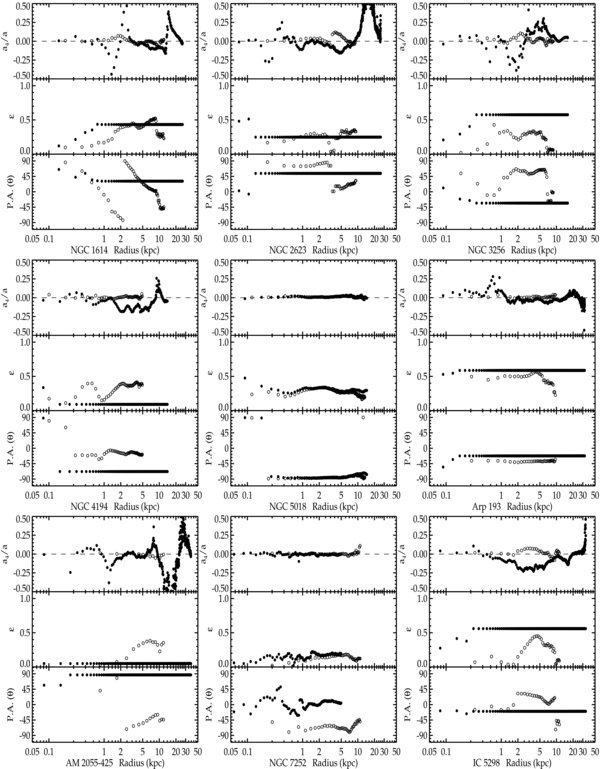
Figure 12. Three panel parameter plots for each galaxy showing a4/a, , and position angle against linear radius. The filled circles are the new I-band HST data and the open circles are the K-band data from RJ04.
Download figure:
Standard image High-resolution imageFigure 13 plots (I − K) as a function of linear radius. The (I − K) values shown are derived from circular isophotes rather than the elliptical isophotes used to generate the surface brightness profiles shown in Figure 11. The choice to use circular isophotes to measure (I − K) profiles is based on the results in Figure 12. Nearly all of the remnants in Figure 12 show different I-band and K-band shapes. Thus, the shape of each elliptical isophote at I and K band is different, which means each isophote is measuring different spatial regions in the galaxy. The (I − K) color constrains information on both stellar and dust distribution.

Figure 13. (I − K) surface brightness profiles of the six LIRGs and three non-LIRGs with available I-band photometry. The profiles are plotted against logarithmic radius. Overplotted are the 1σ error bars.
Download figure:
Standard image High-resolution imageFigure 13 shows a large (I − K) gradient at the centers of the merger remnants (radius ⩽ 1 kpc). At larger radii, the (I − K) color decreases for almost all of the mergers and approaches (I − K) = 1.99, which is the observed color in typical elliptical galaxies (Smith et al. 1997; Pahre et al. 1998a). The exception to this result is NGC 5018, which shows a nearly constant (I − K) ∼ 3, dropping only slightly at large radii.
5.2.4. (I − K) Spatial Maps
Moving from one-dimensional color profiles to two-dimensional spatial maps of the central regions provides further insight into the activity occurring within the central regions of the merger remnants. Figure 14 shows (I − K) spatial maps of the central 10 kpc (diameter) for the nine merger remnants with I- and K-band data. The grayscale of each image has been calibrated to reflect the observed (I − K) values. To the right of each image is a grayscale bar showing the range of (I − K) values for each remnant. Over-plotted in each box is a rectangle representing the slit size and P.A. used to extract the σ○,CaT. The CO slit widths for NGC 1614, NGC 2623, and NGC 5018 are slightly narrower (043, 043 and 03, respectively). The P.A.s of slits used for CO observations of NGC 3256, 4194, Arp 193, and IC 5298 are unknown. The P.A. and slit width used for the 1.6 μm CO observations of AM 2055 − 425 (Genzel et al. 2001) are also shown (dotted box). As noted earlier, the P.A. of the slits was aligned with the major axis of the galaxy as determined from K-band imaging. In some cases, this does not appear to line up with the structure seen in the (I − K) maps. The images in Figure 14 show strong, discrete structure in the central regions, compared to more uniform colors at radii ∼5 kpc. In some cases, there appears to be face-on spiral structure (NGC 1614, NGC 3256, NGC 7252, and IC 5298). NGC 5018 shows the same uniform colors seen in the one-dimensional profiles of Figure 13, with the exception of some dust lane structure near the nucleus. Arp 193 shows either a bar or edge-on disk which is bright in the K band but nearly invisible in the I band. The structures seen in NGC 2623, NGC 4194, and AM 2055 − 425 are less clear, but nonetheless indicate very red (I − K) colors in the central kiloparsec.
Figure 14. (I − K) Spatial maps of the central 10 kpc of nine merger remnants. The grayscale maps are calibrated and reflect the observed (I − K) values for each pixel. The color bar to the right of each image indicates the range of (I − K) values plotted. The solid rectangles in each panel show the width and length of the slit and orientation used to extract the σ○,CaT. CO slit widths for NGC 1614, NGC 2623, and NGC 5018 are slightly narrower (043, 043, and 03, respectively) but of the same length. The P.A.s of slits used for CO observations of NGC 3256, 4194, Arp 193, and IC 5298 are unknown. The P.A. and slit width used for the 1.6 μm CO observations of AM 2055 − 425 (Genzel et al. 2001) are also shown (dotted box).
Download figure:
Standard image High-resolution image5.3. The Central 1.53 h−1 kpc
In the previous section, the σ-discrepancy was shown to correlate with a number of other observables, including LIR, Mdust, L1.4 GHz, K band ΔFP, and M/LK. A comparison with stellar population models showed that in the K-band, IR-bright merger remnants were dominated by a young stellar population. This population also affects the observed σ○,CO in such a way as to underestimate Mdyn. The previous sections have focused on comparing the σ-discrepancy primarily with global properties or observations with poor spatial resolution (e.g., IRAS Flux). The σ-discrepancy, however, arises from measurements of the central 1.53 h−1 kpc. This section focuses on the observed properties within the central 1.53 h−1 kpc, where it exists. The data, unfortunately, are somewhat limited. It comprises I-band photometry for nine mergers, and J,H,K photometry for the entire sample of LIRGs and non-LIRGs. The rotation curves shown in Figure 2 are limited to non-LIRGs which do not show strong σfrac, evidence of young populations or strong star formation. Several of these galaxies do show strong rotation, but the same degree of rotation is present in both the CaT and CO measurements indicating the same stellar population is observed at both wavelengths.
5.3.1. (I − K) Colors
The (I − K) color profiles shown in Figure 13 indicate the largest values are centered on the nuclear regions <1–2 kpc. The (I − K) colors are listed in Table 8. In this section, the (I − K) colors of the merger remnants are compared with stellar population models from M05 to attempt to constrain the ages of the central stellar population and the effects of dust. Figure 15 is a color–magnitude diagram (MK versus (I − K)) for apertures of 1.53 h−1 kpc in diameter, corresponding to the same spatial size as the σ○ measurements. The dash-dotted line in both panels represents the evolution of a solar metallicity burst population assuming a Salpeter IMF from M05 with M = 109 M☉ (top) and M = 1010 M☉ (bottom). Overplotted are the LIRG (open circles) and non-LIRG (filled circles) merger remnants. Also shown are extinction vectors for a foreground dust screen using the values from He et al. (1995) and mixed (dust and stars) from Thronson et al. (1990); Hunt et al. (1997). Ideally, Figure 15 can be used to estimate both the ages and mass of the central stellar population. A young burst (t < 20 Myr) would suggest a central mass ∼109 M☉, while an older burst (20 Myr < t < 1 Gyr) would imply a central mass ∼1010 M☉. A factor of 10 in the mass of the burst population corresponds to a change of 2.5 mag in MK. Thus, the lower limit to Mburst is 109 M☉, because MK of the merger remnants would be brighter than a model with a smaller Mburst. Neglecting the theoretical prediction that the mass in the central few kpc is likely to reside in a rotating disk, the total mass budget within the central 1.53 h−1 kpc can be estimated using σ○,CaT from Table 5, assuming an isotropic velocity dispersion:

where R = 0.765 kpc (radius of the measurement of σ○) and G is shown in galactic units. This gives an upper limit on the mass (neglecting extinction) of the merger remnants of M ∼ 1010–1010.3 M ☉, because MK of the merger remnants would be fainter than a model with a larger Mburst. This would be the total Mdyn within the central 1.53 h−1 kpc, which would include young and old stars. Using this overestimate of the mass would still mean that the burst population is ⩽1 Gyr. Again, this leaves the LIRG merger remnants and NGC 4194 and NGC 7252 (two of the three non-LIRG remnants plotted in Figure 15) with ages consistent with either RSG or AGB stars. This range in starburst mass in merger remnants is consistent with the starburst masses estimated by Shier & Fischer (1998) for their sample of LIRGs.
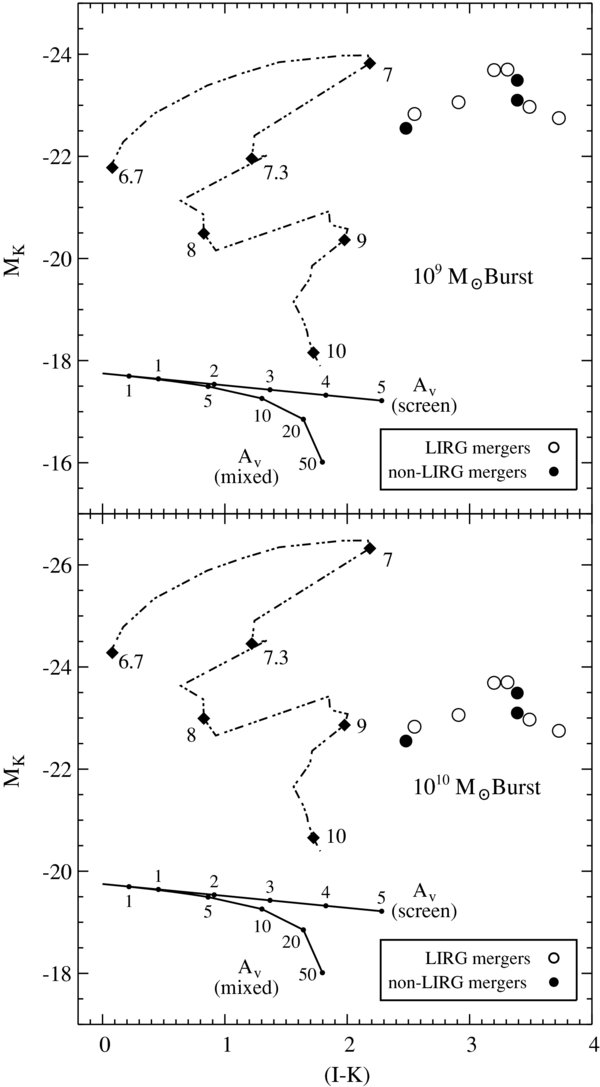
Figure 15. (I − K) vs. MK color–magnitude diagram showing the LIRG (open circles) and non-LIRG (filled circles) merger remnants. The dash-dotted line shows the age evolution of a solar metallicity burst population with Salpeter IMF from M05 for a 109 M☉ burst (top) and a 1010 burst (bottom). The numbers along the tracks indicate the age (log t) of the burst population. Also shown (solid lines) are extinction vectors (in units of AV) for a foreground dust screen and mixed dust and stars. Note: AI ≃ 0.56 AV and AK ≃ 0.10 AV.
Download figure:
Standard image High-resolution imageTable 8. Properties of the Central 1.53 kpc
| Merger | MK | (I − K) | (J − H) | (H − K) | a4/aa |
|---|---|---|---|---|---|
| Name | (mag) | (mag) | (mag) | (mag) | (K band) |
| NGC 1614 | −23.70 | 3.31 | 0.74 | 0.57 | 0.00520 |
| AM 0612 − 373 | −22.82 | ... | ... | 0.38 | −0.01113 |
| NGC 2418 | −23.12 | ... | 0.69 | 0.26 | −0.00440 |
| NGC 2623 | −22.97 | 3.49 | 0.98 | 0.81 | 0.01219 |
| NGC 2914 | −22.29 | ... | 0.62 | 0.39 | 0.00648 |
| NGC 3256 | −23.06 | 2.91 | 0.69 | 0.61 | 0.01348 |
| NGC 4194 | −22.55 | 2.48 | 0.71 | 0.46 | 0.01080 |
| NGC 5018 | −23.49 | 3.39 | 0.64 | 0.37 | 0.01211 |
| Arp 193 | −22.75 | 3.73 | 1.03 | 0.86 | 0.01821 |
| AM 1419 − 263 | −22.66 | ... | 0.67 | 0.37 | 0.00391 |
| AM 2038 − 382 | −23.52 | ... | ... | ... | 0.00325 |
| AM 2055 − 425b | −22.83 | 2.55 | ... | ... | 0.01300 |
| NGC 7252 | −23.10 | 3.39 | 0.75 | 0.44 | 0.00417 |
| IC 5298 | −23.69 | 3.20 | 1.16 | 0.67 | 0.01063 |
Notes. aMean a4/a within 1.53 kpc (radius = 765 pc). bPhotometry is measured within 1.7 kpc due to seeing limitations at K band.
Download table as: ASCIITypeset image
The (I − K) colors of the merger remnants are redder than the evolutionary tracks of the model. The reddest (I − K) colors occur for the young populations at 10 Myr and 0.9 Gyr, and for the older populations of ellipticals at around 10–15 Gyr. The Δ(I − K) between 10 Myr and 0.9 Gyr is 0.19, and between 0.9 Gyr and 15 Gyr is 0.22, which is negligible compared with the differences between the observed central colors of the merger remnants and the reddest colors attained in the starburst model. This implies that significant, albeit varied, reddening is present.
Figure 16 compares Δ(I − K), the change in (I − K) color between the central 1.53 h−1 kpc diameter aperture and the last measured (I − K) isophote in the surface brightness profile of each merger remnant (the last plotted point in Figure 13), with σfrac. The figure depicts the change in color due to the effects, primarily, of dust as a function of radius versus the σ-discrepancy. The Pearson correlation coefficient is also noted in Figure 16, and indicates a moderate correlation. The overplotted dashed line is a least-squares fit to the data:

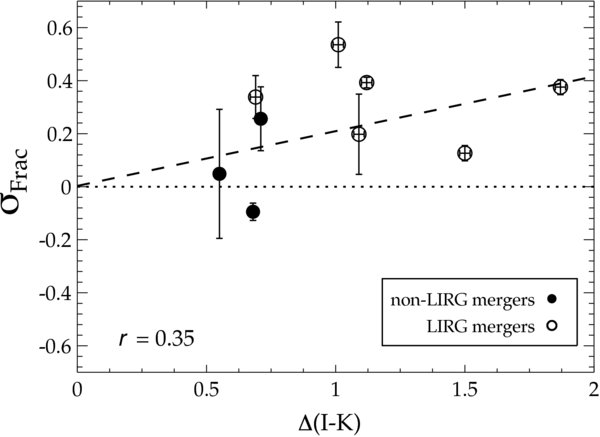
Figure 16. Δ (I − K) vs. σfrac plot which compares the change in (I − K) color between the central 1.53 h−1 kpc diameter aperture and the (I − K) color in the last circular isophote (annulus) of each merger remnant. This corresponds to the last annulus plotted for each merger remnant in Figure 13.
Download figure:
Standard image High-resolution image5.3.2. Near-IR Colors
In Section 5.2.2 and Figure 9, M/LI and M/LK were compared with population models to try to age-date the dominant populations in the central regions of the merger remnants. At K band, the mergers, in particular the LIRGs, were found to have M/L suggestive of significantly younger populations than at I band. However in Section 5.3.1 and in Figure 15, the effects of extinction were found to dominate the central I − K colors of the mergers. In this section, the near-IR colors are compared with the empirical colors of stars and stellar population models in an attempt to better constrain the populations in the central regions. Figure 17 is a (J − H) versus (H − K) color–color plot showing the non-LIRG (filled circles) and LIRG (open circles) merger remnants. The (J − H) and (H − K) colors for the merger remnants are listed in Table 8. The left panel compares the near-IR colors of merger remnants with empirical values of (J − H) and (H − K) of stars (Bessell & Brett 1988; Elias et al. 1985; Guandalini & Busso 2008). The right panel compares the merger remnants with a stellar population model from M05. The models show the evolution of a solar metallicity burst population, assuming a Salpeter IMF. The difference between solar and half or twice solar metallicities is that the latter tracks show no dispersion in (H − K) between 10 Myr and 1 Gyr. The "V"-shape of the tracks between those ages collapse to a single track and the (H − K) colors are indistinguishable at those ages. Overplotted on the stellar model in both panels are various ages of the populations. Also shown in both panels are extinction vectors for a foreground dust screen using the values from He et al. (1995) and mixed (dust and stars) from Thronson et al. (1990) and Hunt et al. (1997).

Figure 17. Two-panel near-IR (J − H) vs. (H − K) color–color diagram showing empirical observations of stars (left) from Bessell & Brett (1988), Elias et al. (1985), and Guandalini & Busso (2008), and a stellar population model from M05 (right) which plots the evolution of a solar metallicity burst population, assuming a Salpeter IMF. Overplotted are the (J − H) and (H − K) colors for non-LIRG (filled circles) and LIRG merger remnants (open circles). Overplotted on the stellar model are various ages of the populations. Two extinction vectors are shown in both panels, a foreground dust screen and mixed stars and dust.
Download figure:
Standard image High-resolution imageThe central aperture IR colors of the LIRGs place them beyond both the models and observed colors of RGBs and RSGs, but within the scatter of observed AGB stars. Mixed dust extinction is consistent with RSG intrinsic colors for the LIRGs, whereas a foreground dust screen is generally not. The IR colors of the non-LIRG merger remnants are much closer or overlap with the observed colors of stars. Several non-LIRGs align with the M05 model where the post-starburst (t > 1 Gyr) stellar populations reside.
Neither the empirical stellar tracks, nor the M05 model in Figure 17 appear capable of clearly identifying the ages or stellar types of the populations within the central 1.53 h−1 kpc aperture. In general, the near-IR colors of the merger remnants are redder than the model or the observed colors of stars, although there is overlap with empirical observations of AGB stars for all of the mergers in Figure 17 (left). Based on the models of integrated colors, significant mixed extinction is suggested by the observed near-IR colors. Without an independent estimate of the extinction (and type of extinction), it is difficult to age-date the nuclear regions satisfactorily using only broadband JHK photometry. In addition, active galactic nuclei (AGNs) are known to have red IR colors, thus the contribution of an AGN might affect the broadband IR colors shown in Figure 17. However, it is unlikely that these mergers contain Type I (unobscured) AGNs. Neither the I- nor the K-band images show strong, bright central QSO-like point sources which overwhelm the host galaxy, typical of objects like Mrk 231 or Mrk 1014 (see Appendix A). Moreover, the 12CO band heads at 1.6 and 2.29 μm have EWs similar to red giants and in the case of the LIRGs, EWs akin to RSGs or AGBs (see forthcoming Paper II for further discussion). The presence of Type I AGNs is accompanied by strong non-thermal near-infrared continuum emission, resulting in weak EWs (e.g., Ridgway et al. 1994; Goldader et al. 1995; Oliva et al. 1999). This is not seen in the sample, nor are very broad hydrogen emission lines (v ⩾ 500 km s−1) present. Spectroscopy should be able to resolve these issues clearly in three ways: (1) use specific spectral features, both absorption and emission, to age-date the populations; (2) use hydrogen emission lines and [Fe ii] (if present) to effectively constrain the amount of dust present; and (3) assess the presence of relative contribution of an AGN to the near-IR flux. Such spectroscopic analysis will be presented in Paper II.
5.3.3. Isophotal Shapes
If the central regions of the merger remnants are dominated in the IR by a star-forming, rotating stellar disk, this should also be reflected in the K-band isophotal shapes. The a4/a parameter can be used to determine whether isophotes are disky (positive a4/a) or boxy (negative a4/a). Figure 18 compares the average a4/a value within the central 1.53 h−1 kpc with σfrac (top) and the radio luminosity at 1.4 GHz (bottom). The average a4/a value within the central 1.53 h−1 kpc for each merger remnant is listed in Table 8. The top panel in Figure 18 demonstrates a weak correlation (r = 0.24) between disky isophotal shape and σfrac. As the K-band continuum appears to be dominated by RSGs or AGBs for the merger remnants with largest σfrac, this suggests these stars exist in a disky structure.

Figure 18. Two-panel figure comparing the average a4/a within 1.53 h−1 kpc with σfrac (top) and L1.4 GHz (bottom). Overplotted are the non-LIRG merger remnants (filled circles) and LIRG merger remnants (open circles). The vertical dotted line in both panels indicates the transition between boxy (negative) and disky (positive) a4/a values. The horizontal dotted line in the top panel denotes σfrac = 0. The horizontal dotted line in the bottom panel is log L1.4 GHz = 22 W Hz−1, which marks the transition between radio quiet and radio loud in galaxies at 1.4 GHz. The correlation coefficients are noted in each panel. The overplotted dashed lines in both panels are least-squares fits to the data.
Download figure:
Standard image High-resolution imageThe bottom panel in Figure 18 shows the a4/a parameter plotted against L1.4 GHz measured in a diameter of 1.53 h−1 kpc. The horizontal line in this panel denotes the difference between radio loud and radio quiet emission. The merger remnants show a moderate correlation of r = 0.40, between L1.4 GHz and a4/a. The outlier is NGC 5018, which is rather radio quiet relative to other remnants (Moellenhoff et al. 1992). Excluding NGC 5018 (lower right point in bottom of Figure 18) increases the Pearson correlation coefficient to a strong correlation of r = 0.73. The 1.4 GHz emission plotted in Figure 18 is compact and measured within a region similar in size to that of the σ○ observations and on roughly the same scales as those of theoretical predictions for disk formation. The presence of disky isophotes and its correlation, shown in Figure 18, with radio power are consistent with the presence of strong star formation occurring within a central disk.
6. DISCUSSION
The results presented here paint a complex picture of the central structure of IR-bright mergers. The near-IR flux distributions, particularly at H and K bands, are dominated by the presence of young stars. The signature of these stars is perhaps most strikingly evident in the displacement towards high surface brightness of the IR-bright mergers from the K-band FP, compared with the lack of displacement in the I-band FP. Observations and numerical simulations have long predicted that gaseous dissipation in the merging event funnels the gas into the barycenter of the merger (e.g., Toomre & Toomre 1972; Schweizer 1982; Barnes & Hernquist 1991, 1996; Barnes 2002). This forms a rotating gaseous disk in the central 1–2 kpc of the merger, which then undergoes a strong starburst, forming a rotating disk of young stars. Observationally, it has also been known for quite some time that the H-band and K-band flux and strength of the CO band heads indicate the presence of young stellar populations in LIRGs/ULIRGs (e.g., Doyon et al. 1989; Origlia et al. 1993; Doyon et al. 1994; Ridgway et al. 1994; Smith et al. 1995; Armus et al. 1995; Goldader et al. 1995; Oliva et al. 1995; Shier et al. 1996; Goldader et al. 1997a, 1997b; Shier & Fischer 1998; Tecza et al. 2000; Davies et al. 2004). Shier et al. (1996); Shier & Fischer (1998) suggested that the observed young populations in LIRGs could reside in a central disk, in accordance with the theoretical predictions, RJ04 observed "excess light" in the surface brightness profiles of mergers (e.g., MH94) attributing it to young populations, and Davies et al. (2004) inferred a warped disk structure in the ULIRG Mrk 231 from adaptive optics long-slit H-band spectroscopy.
The σ-discrepancy detected in IR-luminous galaxies is another observational signature of these rotating central starbursts. The work presented here has shown that dust associated with these nuclear starbursts blocks most of their light at λ < 1 μm, allowing the random motions of the nearly virialized older stars to dominate the σ○ measurement at I band. This is corroborated by the very red central (I − K) colors which are consistent with the effects of dust (Figure 15). The dynamical impact is demonstrated by the fact that IR-bright mergers show relatively low σ○ compared to ellipticals when plotted on the K-band FP, but are strikingly similar to ellipticals when plotted on the I-band FP (Figures 6 and 8). This conclusion is further supported by the correlation of σfrac with Δ(I − K) and star formation indicators such as LIR, Mdust, L1.4 GHz, ΔFPK, and M/LK.
Figure 19 is a schematic view of this picture in which the presence of dust functions in a manner similar to that of an occulting mask in a coronagraph, preventing the luminous central disk of young stars (left) from overwhelming the desired observational measurement. During the IR-bright phase, at K band (and H band), the kinematic measurements "see" and are overwhelmed by the central disk of young stars which can be dominated by the light of RSG or AGB stars. At I band, the many magnitudes of (probably mixed) dust associated with the starburst effectively suppresses the light from these stars, allowing the older, nearly virialized stellar component to dominate the kinematic measurement. Thus, the CO band heads are useful for observing the rotation of the central disk of young stars and not the random motions of the spheroid in IR-luminous mergers. This explains and is consistent with recent results from Veilleux et al. (2009) in which BH masses inferred from σCO were systematically smaller than those derived by other methods.

Figure 19. Schematic views illustrating the differing effects of dust on the light from a rotating disk of luminous young stars in the I band and K band which explains the σ-discrepancy. The "observer's" line of sight is denoted by the eye in the upper, left corner. The central rotating disk of (presumably RSG or AGB) stars is pictured in both panels, the dark gray clouds represent the stronger effects of dust at I band (left), and the smaller sized stars represent late-type giants moving in random orbits. The degree of dust obscuration diminishes in the K band (right). At I band, the dust acts like the mask of a coronagraph, preventing the biasing effect of bright young stars from dominating the Mdyn measurement.
Download figure:
Standard image High-resolution imageAs demonstrated by their tidal features and light profiles in both the I and K bands, the mergers in this sample are the products of major mergers between disks. Based on a preliminary analysis, the spectra to be presented in Paper II show evidence of some gaseous emission remaining and hydrogen absorption lines indicative of the presence of an A-type stellar population, which suggests that the non-LIRG mergers are or will soon become E+A (or K+A) galaxies, an evolutionary stage first suggested by Schweizer (1990). H i observations of the non-LIRGs show evidence of large reservoirs of gas still present (e.g., Hibbard & van Gorkom 1996; Hibbard et al. 2001) which further supports a gas-rich origin. At later times in the evolution of the merger, typified by the non-LIRG merger remnants, the stars in the central disk evolve and dust clears out. Eventually, the H- and K-band light is dominated by the same late-type stars seen in the I band and σ○,CaT = σ○,CO, as is the case in elliptical galaxies. The central stellar disk remains, but its relative contribution to the total light is significantly smaller.
The central rotating disk of stars responsible for the σ-discrepancy may be a "transitional fossil" between gas disks and kinematically decoupled cores (KDCs) present in ∼1/3 of luminous elliptical galaxies (Kormendy 1984; Franx & Illingworth 1988; Jedrzejewski & Schechter 1988; Bender et al. 1988, 1989; Bender & Surma 1992). There is observational evidence for this based on counter-rotating gas, first found in NGC 7252 (Schweizer 1982, 1983; Wang et al. 1992) and theoretical work linking this to KDCs (Hernquist & Barnes 1991). In fact, Figure 2 reflects this phenomenon, as clear rotation can be seen in several merger remnants, and in some cases suggests the presence of not only a disk, but a KDC.
Recently, Overzier et al. (2009) observed a sample of local analogs of Lyman break galaxies and found a subsample which contained very luminous central objects with unusually high surface densities (similar to cusps in ellipticals or the "excess light" in mergers first observed by RJ04), young ages (t < few Myr), and surrounded by a disturbed envelope or disk. Dubbed "dominant central objects," their host galaxies have mid-IR luminosities (as observed at 24 μm) similar to LIRGs, but do not show signs of obscuration at UV wavelengths. They may represent an early stage of the massive starbursts in gas-rich mergers prior to the onset of the LIRG/ULIRG phase.
The data presented here have a significant impact in the context of high-redshift observations, in particular on observations of red and (apparently) dead galaxies interpreted as an indication of the dominance of passively evolving gas-free (or often simplistically referred to as "dry") mergers. The LIRGs studied in this paper are Janus like, that is, present two completely different faces depending on how they are observed. In the I band, the LIRGs behave photometrically and kinematically like old galaxies, with only their tidal features betraying their unusual nature. Could LIRGs/ULIRGs be confused with old, red and dead galaxies if observed at the "wrong" wavelength? Could massive, star-forming galaxies be misidentified as either red and dead (or underweight) depending on what part of their SED is observed? Two such examples demonstrate this. In the first, Donovan et al. (2007) note the need for careful selection criteria in picking out "red" mergers. Using the H i Rogues sample (Hibbard et al. 2001), a gallery of peculiar galaxies with H i gas, including merger remnants and ellipticals, they showed that color selection (in this case, (B − R) for z < 0.5) is insufficient for the selection of gas-free galaxies. Using the same criteria as van Dokkum (2005), who concluded that gas-free merging is almost entirely responsible for the formation of all elliptical galaxies in the local universe, Donovan et al. (2007) found that 75% of their H i sample would be classified as "red," gas-free mergers.
In the second example, the presence of AGB stars can significantly affect both the age and mass measurements of high-z galaxies. Maraston et al. (2006) used stellar population models from M05 to age-date and infer the mass (using spectral energy distribution (SED) fitting only) of 1.4 ⩽ z ⩽ 2.7 galaxies in Great Observatories Origins Deep Survey (GOODS). Comparing the same galaxies which were studied in Yan et al. (2004), but using models from Bruzual & Charlot (2003) which do not include a full treatment of AGB stars in the infrared, resulted in masses and ages which differed, on average, by 60%. The inclusion of AGB stars in the analysis changed the red and dead galaxies, into young, dusty, star-forming galaxies.
7. SUMMARY AND FUTURE WORK
The main results from this paper are summarized below.
- 1.The σ-discrepancy shows a strong dependence on LIR in merger remnants but is essentially non-existent in elliptical galaxies. It is a real phenomenon which shows correlations with other, independently observed parameters, including LIR, Mdust, L1.4 GHz, K-band ΔFP (the residuals from the FP), M/LK, Δ(I − K) (color differential between nucleus and outer parts of galaxy), and a clustering effect with nuclear spatial geometry.
- 2.The non-LIRG merger remnants found to lie on or near the "pure" I- and K-band FPs presented in this paper show CaT and CO rotation curves consistent with each other.
- 3.LIRG and non-LIRG merger remnants are virtually indistinguishable from elliptical galaxies on the I-band FP. They show nearly the same dynamic range in σ○, Reff, and 〈μI〉eff as ellipticals, in stark contrast to their behavior in the K band, where LIRGs (and non-LIRGs with the brightest LIR) cluster together away from the FP. The Mdyn's inferred from the σ○,CaT are significantly larger than those inferred from the σ○,CO. Using M/L to probe the ages of the stellar populations implies the presence of an older population based on I-band measurements, and a young population when based on the K-band properties.
- 4.I-band and K-band surface brightness profiles, (I − K) profiles, and (I − K) spatial maps suggest the presence of strong dust concentrations. Coupled with the σ-discrepancy, and results from the FP, the I band and K band appear to be depicting independent components in the central regions of IR-bright merger remnants. Using an MK versus (I − K) color–magnitude diagram, the mass range of the central starburst population is constrained to be 109–1010 M☉ and the red (I − K) colors indicate enough dust is present to effectively mask this young population at shorter wavelengths.
- 5.The observations presented in this paper are consistent with the theoretical predictions for the presence of a young, stellar disk within the central few kiloparsecs of the merger remnants. This disk would have been formed during the merging event via gaseous dissipation and its presence appears to be obscured at shorter wavelengths. A similar set of physical conditions, namely the obscuration by dust of the rotating stellar disk in S0 galaxies, was observed by SG03.
An important next step is to obtain σ○,CaT measurements for a volume-limited sample of merger remnants with LIR > 1012 L ☉ in order to determine whether σ○,CaT yields larger masses than those derived from σ○,CO for the most luminous mergers and fully characterize the IR-bright merger remnants. To date, there have been no published σ○,CaT for bona fide ULIRGs. That both LIRG and non-LIRG remnants lie on the I-band FP based on observations of the sample studied here, suggests that the true Mdyn's are being probed at I band. Applying the relationship given in Equation (7), it is possible to predict the σ-discrepancy (and σ○,CaT) for ULIRGs. Using previously published σ○,CO as a starting point, it is predicted that future observations will measure 190 km s−1 ⩽ σ○,CaT ⩽ 390 km s1 for ULIRGs. When non-LIRG and LIRG merger remnants are included, gas-rich mergers should span the entire range of σ○ (and thus the entire mass-range) observed in elliptical galaxies.
Broadband photometry and reliance on only the CaT absorption lines and CO band heads is insufficient to accurately age-date the observed stellar populations. The presence of strong molecular features in the near, near-IR, such as TiO, CN, C2, and H2O (e.g., Lançon et al. 1999; Lançon & Wood 2000; Mouhcine & Lançon 2003; Maraston 2005; Riffel et al. 2007; Lançon et al. 2008), along with nebular emission lines (e.g., Leitherer et al. 1999) make it possible to more effectively constrain the ages of a stellar population. Low-resolution (R ∼ 800–1200) near-IR (1–2.5 μm) slit spectra have been obtained for the sample presented in this paper and will be analyzed in conjunction with population models from M05 and Starburst99 (Leitherer et al. 1999) to age-date the stellar populations in the central 1.53 h−1 kpc. This will be combined with long-slit optical spectra (0.4–0.9 μm) obtained with ESI on Keck II to confirm that the I-band photometry and σ○,CaT is indeed detecting only the old late-type stars. Analysis of this data will be the focus of Paper II.
This research was performed while B.R. held a National Research Council Associateship Award at the Naval Research Laboratory. Basic research in astronomy at the Naval Research Laboratory is funded by the Office of Naval Research. A special thanks is given to Michael Cushing for his help and guidance in developing the IDL code used to measure the velocity dispersions from extracted spectra. The authors also thank Sandrine Bottinelli for assisting with some of the near-IR observations, Claudia Maraston for very helpful discussions regarding stellar population models, and Francois Schweizer for providing comments and suggestions for the manuscript. This research has made use of the NASA/IPAC Extragalactic Database (NED) which is operated by the Jet Propulsion Laboratory, California Institute of Technology, under contract with the National Aeronautics and Space Administration. This publication makes use of data products from the Two Micron All Sky Survey, which is a joint project of the University of Massachusetts and the Infrared Processing and Analysis Center/California Institute of Technology, funded by the National Aeronautics and Space Administration and the National Science Foundation.
APPENDIX A: HST/F814W AND GROUND-BASED K-BAND IMAGES
Figure A.1 shows the nine F814W and their corresponding K-band images.

Figure A.1. F814W and K-band images for each of the nine mergers observed with HST. The images are centered on each galaxy and presented in reverse grayscale with a logarithmic stretch. Overplotted on each image is a horizontal solid bar representing 5 h−1 kpc.
Download figure:
Standard image High-resolution imageAPPENDIX B: Ca ii TRIPLET AND 2.3 μm CO BAND HEAD SPECTRA
Figure B.1 shows the CaT and CO spectra plotted for the merger remnants and the E0 elliptical.
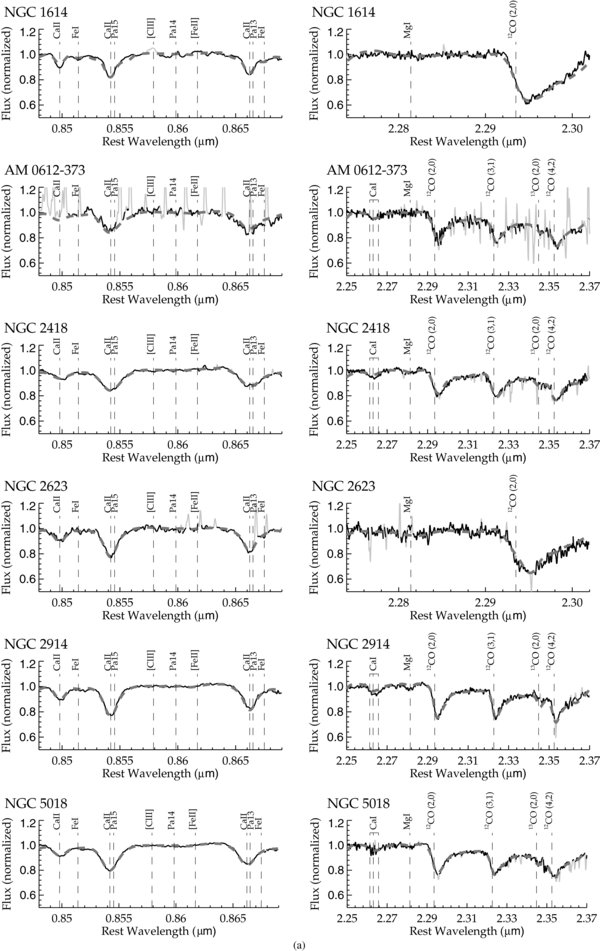
Download figure:
Standard image High-resolution image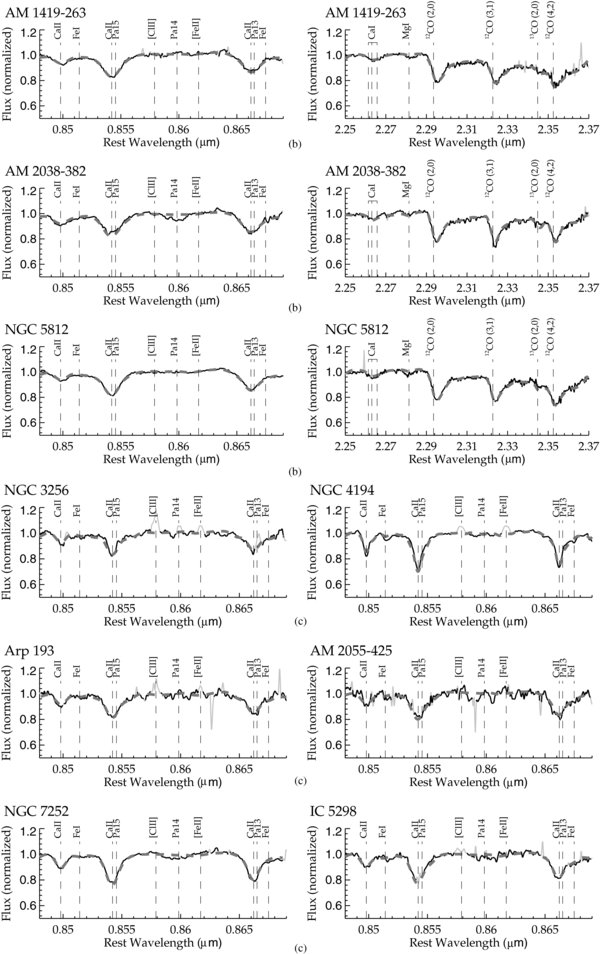
Figure B.1. (a) Shown are CaT spectra (left column) and CO spectra (right column). The solid black lines show the actual spectrum used in the fitting, the light gray lines show masked bad pixels or emission lines. The thick dashed line shows the best-fit convolved template. Also shown are the positions of emission and absorption lines within the wavelength range. (b) Same as previous figure. (c) Similar to previous two figures, but only the CaT spectra are shown. These are merger remnants for which the σ○,CO were obtained from the literature.
Download figure:
Standard image High-resolution image
Footnotes
- *
Some of the data presented herein were obtained at the W. M. Keck Observatory, which is operated as a scientific partnership among the California Institute of Technology, the University of California and the National Aeronautics and Space Administration. The Observatory was made possible by the generous financial support of the W. M. Keck Foundation.
- †
Based on observations obtained at the Gemini Observatory, which is operated by the Association of Universities for Research in Astronomy, Inc., under a cooperative agreement with the NSF on behalf of the Gemini partnership: the National Science Foundation (United States), the Science and Technology Facilities Council (United Kingdom), the National Research Council (Canada), CONICYT (Chile), the Australian Research Council (Australia), Ministério da Ciência e Tecnologia (Brazil), and SECYT (Argentina).
- 2
IRAF is distributed by the National Optical Astronomy Observatory, which is operated by the Association of Universities for Research in Astronomy, Inc., under cooperative agreement with the National Science Foundation.