


ABSTRACT
We present the first comprehensive analysis of Hubble Space Telescope (HST) observations of short-duration gamma-ray burst (GRB) host galaxies. These observations allow us to characterize the galactic and local environments of short GRBs as a powerful constraint on the nature of their progenitors. Using the HST data for 10 short GRB hosts, we determine the host morphological properties, measure precise physical and host-normalized offsets relative to the galaxy centers, and study the locations of short GRBs relative to their host light distributions. We find that most short GRB hosts have exponential disk profiles, characteristic of late-type galaxies, but with a median size that is twice as large as that of long GRB hosts, commensurate with their higher luminosities. The observed distribution of projected physical offsets, supplemented by ground-based measurements, has a median of ≈5 kpc, about five times larger than that for long GRBs, and in good agreement with predicted offset distributions for neutron star–neutron star (NS–NS) binary mergers. For the short GRB population as a whole, we find the following robust constraints: (1) ≳25% have projected offsets of ≲10 kpc; and (2) ≳5% have projected offsets of ≳20 kpc. We find no clear systematic trends for the offset distribution of short GRBs with and without extended soft emission. While the physical offsets are larger than those for long GRBs, the distribution of host-normalized offsets is nearly identical due to the larger size of short GRB hosts. Finally, unlike long GRBs, which are concentrated in the brightest regions of their host galaxies, short GRBs appear to under-represent the light distribution of their hosts; this is true even in comparison to core-collapse and Type Ia supernovae. Based on these results, we conclude that short GRBs are consistent with a progenitor population of NS–NS binaries, but partial contribution from prompt or delayed magnetar formation is also consistent with the data. Our study underscores the importance of future HST observations of the larger existing and growing sample of short GRB hosts, which will allow us to delineate the properties of the progenitor population.
Export citation and abstract BibTeX RIS
1. INTRODUCTION
The galactic and local environments of cosmic explosions provide powerful insight into the nature of their progenitors. For example, past studies of supernova (SN) environments have demonstrated that Type Ia and Type Ib/Ic/II events arise from distinct progenitor systems since the former are located in all types of galaxies, while the latter occur only in star-forming galaxies, pointing to a direct link with massive stars (e.g., van den Bergh et al. 2005). In a similar vein, long-duration gamma-ray bursts (GRBs; duration, T90 ≳ 2 s) have been linked with massive stars through their exclusive association with star-forming galaxies (e.g., Bloom et al. 1998; Djorgovski et al. 1998; Fruchter et al. 1999). Short-duration GRBs, on the other hand, are now known to reside in all types of galaxies (Berger et al. 2005; Fox et al. 2005; Gehrels et al. 2005; Bloom et al. 2006; Berger 2009). Moreover, even the star-forming host galaxies of short GRBs differ from those of long GRBs; they have higher luminosities and metallicities, and lower specific star formation rates (Berger 2009). The difference between long and short GRB host galaxies, along with the lack of SN associations for short GRBs (Berger et al. 2005; Fox et al. 2005; Gehrels et al. 2005; Hjorth et al. 2005; Bloom et al. 2006; Soderberg et al. 2006), demonstrates that they have distinct progenitor populations. In particular, at least some short GRBs are associated with an older progenitor population.
Equally important are the local, sub-galactic environments. In the case of long GRBs, the distribution of their projected physical and host-normalized offsets relative to the host centers matches the overall expected distribution for massive stars in an exponential disk (Bloom et al. 2002). An analysis of the brightness distribution at the locations of long GRBs indicates that they are disproportionately concentrated on the brightest regions of their hosts, primarily in comparison to core-collapse SNe, which follow the overall light distribution of their hosts (Fruchter et al. 2006). Both of these studies have relied on high angular resolution Hubble Space Telescope (HST) imaging observations. Preliminary studies of short GRB offsets (Berger et al. 2005; Fox et al. 2005; Bloom & Prochaska 2006; Soderberg et al. 2006; Troja et al. 2008; D'Avanzo et al. 2009) reveal somewhat larger projected physical offsets than for long GRBs, and have also led to a claimed trend of smaller offsets for short GRBs with extended X-ray emission (Troja et al. 2008). No study of the locations of short GRBs relative to their hosts light distribution has been published so far.
Progenitor models of short GRBs lead to distinct predictions about the distribution of host properties and the local environments of short GRBs (measured by their offsets and location relative to the host light distribution). In particular, the popular model of neutron star and/or black hole (BH) binary mergers (NS–NS/NS–BH; Eichler et al. 1989; Narayan et al. 1992) predicts larger offsets than for the massive star progenitors of long GRBs due to potential systemic velocity kicks. Various authors have employed population synthesis models to predict the distribution of offsets by convolving distributions of kick velocities, merger timescale, and galaxy masses (Bloom et al. 1999; Fryer et al. 1999; Belczynski et al. 2006). For Milky Way mass galaxies, appropriate for short GRB hosts (Berger 2009), the predicted offset distributions have a median of ∼5–10 kpc, with a broad tail extending to tens of kpc. On the other hand, progenitor models that invoke magnetars, either from a young population or through delayed formation in a white dwarf–white dwarf (WD–WD) merger or white dwarf accretion-induced collapse (Levan et al. 2006b; Metzger et al. 2008), are expected to have a modest offset distribution since these systems do not experience kicks. Similarly, any systematic differences in the progenitors of short GRBs with and without extended X-ray emission may be revealed in the offset distribution and specific sub-galactic environments.
To confront these models with observations, we require high angular resolution imaging, best provided by HST. Such observations provide detailed information on the host galaxy morphological properties (e.g., exponential disk versus de Vaucouleurs profile, effective radius), as well as the ability to precisely measure offsets and the distribution of short GRBs relative to their host light. HST observations have served as the backbone for detailed studies of long GRB environments and host galaxy morphologies (Bloom et al. 2002; Fruchter et al. 2006; Wainwright et al. 2007). To date, HST observations of only three short GRBs have been published (050709: Fox et al. 2005; 060121: Levan et al. 2006a; 080503: Perley et al. 2009), and in only one case (050709) was the host morphology addressed.
Here, we present the first comprehensive analysis of all short GRB host galaxies observed with HST to date.3 Using these observations, we determine the host morphologies and structural properties (Section 3), we calculate precise physical and host-normalized offsets using accurate astrometry relative to ground-based afterglow images (Section 4), and we construct the first distribution of short GRB locations relative to their host light (Section 5). We draw conclusions in the context of progenitor models in Section 6. Throughout the paper, we compare and contrast the results of our analysis with similar studies of long GRBs.
We find that: (1) the short GRB hosts have systematically larger effective radii than long GRB hosts, in good agreement with their higher luminosities; (2) the observed short GRB projected physical offset distribution has a median of about 5 kpc, about a factor of 5 times larger than long GRBs, while for the population as a whole ≳25% have projected offsets of ≲10 kpc, and ≳5% have projected offsets of ≳20 kpc; (3) both the observed physical offset distribution and the robust constraints closely match the predicted offset distribution of NS–NS binaries; and (4) short GRBs uniformly trace the light distribution of their hosts, similar to core-collapse SNe, but distinct from long GRBs.
2. HST DATA REDUCTION AND ANALYSIS
2.1. Sample
We present HST optical observations of ten short GRB host galaxies obtained with the Advanced Camera for Surveys (ACS) and the Wide-Field Planetary Camera 2 (WFPC2). The data were obtained as part of programs 10119, 10624, and 10917 (PI: Fox), as well as 10780 and 11176 (PI: Fruchter). These programs targeted all short GRBs with optical and X-ray (XRT) positions from May 2005 to December 2006, which were visible during HST 2-gyro operations. In this time frame, the only short burst that was not observed was GRB 060801. Thus, the sample in this paper is nearly complete in relation to the short GRBs with optical/X-ray afterglows.4 The HST observations of GRBs 050709 and 060121 have been published previously by Fox et al. (2005) and Levan et al. (2006a), respectively, but we re-analyze them here in a uniform fashion and perform a more comprehensive analysis of the host morphology and burst environment. Seven of the 10 bursts have been localized to sub-arcsecond precision from optical afterglow detections, and five have known redshifts (Table 1); we use a constraint of z ≳ 1.4 for GRB 051210 (Berger et al. 2007).
Table 1. HST Observations of Short GRB Host Galaxies
| GRB | R.A. | Decl. | Uncert. | OA? | z | Instrument | Filter | Date | Exp. Time | AB Maga | Aλb |
|---|---|---|---|---|---|---|---|---|---|---|---|
| (J2000) | (J2000) | ('') | (UT) | (s) | (mag) | ||||||
| 050509b | 12h36m14 06 06 |
+28°59'07 2c 2c |
3.4 | N | 0.226 | ACS | F814W | 2005 May 14 | 6870 | 16.32 | 0.037 |
| 12h36m1376 |
+28°59'032 |
3.3 | |||||||||
| 050709 | 23h01m2696 |
−38°58'395 |
0.2 | Y | 0.1606 | ACS | F814W | 2006 Jul 16 | 6981 | 21.09 | 0.02 |
| WFPC2 | F450W | 2007 Jul 29 | 3200 | 21.43 | 0.045 | ||||||
| 050724 | 16h24m4438 |
−27°32'275 |
0.1 | Y | 0.257 | WFPC2 | F450W | 2008 Apr 7 | 3200 | 19.98 | 2.645 |
| WFPC2 | F814W | 2008 May 18 | 3200 | 18.74 | 1.189 | ||||||
| 051210 | 22h00m4126 |
−57°36'465 |
2.9 | N | >1.4 | WFPC2 | F675W | 2007 Apr 3 | 2800 | 21.14 | 0.052 |
| 22h00m4133 |
−57°36'494 |
1.7 | |||||||||
| 051221a | 21h54m4863 |
+16°53'274 |
0.2 | Y | 0.5465 | WFPC2 | F555W | 2007 Aug 13 | 3200 | 21.86 | 0.227 |
| WFPC2 | F814W | 2007 Aug 22 | 1600 | 21.42 | 0.133 | ||||||
| 060121 | 09h09m5199 |
+45°39'456 |
0.1 | Y | ⋅⋅⋅ | ACS | F606W | 2006 Feb 27 | 4400 | 26.22 | 0.047 |
| 060313 | 04h26m2842 |
−10°50'399 |
0.2 | Y | ⋅⋅⋅ | ACS | F475W | 2006 Oct 13 | 2088 | 26.38 | 0.300 |
| ACS | F775W | 2006 Oct 14 | 2120 | 25.61 | 0.135 | ||||||
| 060502b | 18h35m4553 |
+52°37'529 |
3.7 | N | ⋅⋅⋅ | ACS | F814W | 2006 May 15–Jul 16 | 25224 | 17.88/24.8–27.5d | 0.085 |
| 18h35m4528 |
+52°37'547 |
5.8 | |||||||||
| 061006 | 07h24m0778 |
−79°11'555 |
0.2 | Y | 0.4377 | ACS | F814W | 2006 Oct 14 | 6054 | 21.67 | 0.616 |
| WFPC2 | F555W | 2008 May 22 | 3200 | 23.90 | 1.052 | ||||||
| 061201 | 22h08m3209 |
−74°34'471 |
0.2 | Y | 0.111/⋅⋅⋅ e | ACS | F606W | 2006 Dec 11 | 2178 | 18.17/25.34f | 0.251 |
| ACS | F814W | 2006 Dec 11 | 2244 | 17.82/25.03f | 0.147 |
Notes. Summary of short GRB positions and redshifts, HST observations, and host galaxy magnitudes (calculated using IRAF/ellipse). aThese values have been corrected for Galactic extinction. bGalactic extinction. cIn all cases with Swift/XRT positions, the top and bottom set of coordinates are from the catalogs of Butler (2007) and Evans et al. (2009), respectively. dThese magnitudes correspond to galaxy "A" and galaxies "B"–"G" in Figure 8. eWe consider two possible host galaxies for this burst (see Appendix B). fThe first value is for galaxy "A" and the second is for galaxy "B" in Figure 10.
Download table as: ASCIITypeset image
Six of the seven short GRBs with sub-arcsecond localization are robustly associated with host galaxies5 (we present a host identification for GRB 060313 in this paper; see Appendix A). The sole exception is GRB 061201, for which we explore two possible host galaxy associations based on the HST observations (see Appendix B); previously only one galaxy (at z = 0.111) was considered a potential host (Berger et al. 2007; Stratta et al. 2007). Details of the GRB properties and the HST observations are provided in Table 1.
Throughout the paper, we use the standard cosmological parameters, H0 = 71 km s−1 Mpc−1, Ωm = 0.27, and ΩΛ = 0.73. All reported magnitudes are corrected for Galactic extinction using Schlegel et al. (1998) dust maps.
2.2. HST Data Reduction
We retrieved pre-processed images from the HST archive6 for all available short GRBs. We distortion-corrected and combined the individual exposures using the IRAF task multidrizzle (Fruchter & Hook 2002; Koekemoer et al. 2002). For the ACS images, we used pixfrac = 0.8 and pixscale = 0.05 arcsec pixel−1, while for the WFPC2 images, we used pixfrac = 1.0 and pixscale = 0.0498 arcsec pixel−1, half of the native pixel scale. The final drizzled images, flux-calibrated to the AB magnitude system according to the ACS and WFPC2 zero points, are shown in Figures 1–10.

Figure 1. Left panel: HST/ACS/F814W image of the location of GRB 050509b. The circles mark the X-ray positions of the afterglow from the analysis of Butler (2007; red) and Evans et al. (2009; blue). Center panel: Sérsic model fit from galfit. Right panel: residual image.
Download figure:
Standard image High-resolution image
Figure 2. Top left panel: HST/ACS/F450W image of the host galaxy of GRB 050709 with a 10σ error circle representing the afterglow position. Top center panel: Sérsic model fit from galfit. Top right panel: residual image. Bottom panels: same, but for the HST/WFPC2/F814W observations.
Download figure:
Standard image High-resolution image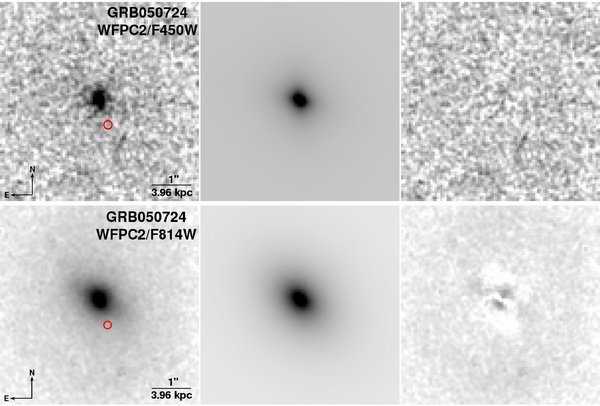
Figure 3. Top left panel: HST/WFPC2/F450W image of the host galaxy of GRB 050724 with a 5σ error circle representing the afterglow position. Top center panel: Sérsic model fit from galfit. Top right panel: residual image. Bottom panels: same, but for the HST/WFPC2/F814W observations.
Download figure:
Standard image High-resolution image
Figure 4. Top left panel: HST/WFPC2/F675W image of the location of GRB 051210. The circles mark the X-ray positions of the afterglow from the analysis of Butler (2007; red) and Evans et al. (2009; blue). Top center panel: Sérsic model fit from galfit with a fixed value of n = 1. Top right panel: residual image. Bottom panels: same, but for Sérsic model fit from galfit with a fixed value of n = 4.
Download figure:
Standard image High-resolution image
Figure 5. Top left panel: HST/WFPC2/F555W image of the host galaxy of GRB 051221 with a 5σ error circle representing the afterglow position. Top center panel: Sérsic model fit from galfit. Top right panel: residual image. Bottom panels: same, but for the HST/WFPC2/F814W observations.
Download figure:
Standard image High-resolution image
Figure 6. Top left panel: HST/ACS/F606W image of the host galaxy of GRB 060121 with a 3σ error circle representing the afterglow position. The image has been smoothed with a 2 × 2 pixel Gaussian. Top center panel: Sérsic model fit from galfit with a fixed value of n = 1. Top right panel: residual image. Bottom panels: same, but for Sérsic model fit from galfit with a fixed value of n = 4.
Download figure:
Standard image High-resolution image
Figure 7. Top left panel: HST/ACS/F475W image of the host galaxy of GRB 060313 with a 3σ error circle representing the afterglow position. The image has been smoothed with a 3 × 3 pixel Gaussian. Top center panel: Sérsic model fit from galfit with a fixed value of n = 1. Top right panel: residual image. Second row panels: same, but for Sérsic model fit from galfit with a fixed value of n = 4. Third row panels: same, but for the HST/WFPC2/F775W observations with a fixed value of n = 1. Bottom row panels: same, but for the HST/WFPC2/F775W observations with a fixed value of n = 4.
Download figure:
Standard image High-resolution image
Figure 8. HST/ACS/F814W images of the host galaxy of GRB 060502b. The circles mark the X-ray positions of the afterglow from the analysis of Butler (2007; red) and Evans et al. (2009; blue). The bright galaxy marked "A" is located at z = 0.287 (Bloom et al. 2007). Several fainter galaxies ("B"–"G") are located within the XRT error circles (see Appendix C).
Download figure:
Standard image High-resolution image
Figure 9. Top left panel: HST/ACS/F555W image of the host galaxy of GRB 061006 with a 3σ error circle representing the afterglow position. Top center panel: Sérsic model fit from galfit. Top right panel: residual image. Bottom panels: same, but for the HST/ACS/F814W observations.
Download figure:
Standard image High-resolution image
Figure 10. Left panel: HST/ACS/F606W image of the location of GRB 061201. The bright galaxy at the upper right-hand corner ("A") is located at z = 0.111 (Berger 2006; Stratta et al. 2007) with an offset of about 32.5 kpc. A second, fainter galaxy ("B") is located about 18 away from the optical afterglow position (see Appendix B). Right panel: same, but for the HST/ACS/F814W observations.
Download figure:
Standard image High-resolution image2.3. Surface Brightness Profile Fitting
We use two methods to fit the surface brightness profiles of the short GRB host galaxies. First, we use the galfit software package (Peng et al. 2007) to construct the best two-dimensional ellipsoidal model of each galaxy image. Second, we use the IRAF task ellipse to produce elliptical intensity isophotes and to construct one-dimensional radial surface brightness profiles. We further use ellipse to measure the integrated AB magnitude for each galaxy (listed in Table 1).
2.3.1. galfit
As an input to galfit, we generate point-spread function (PSF) models for each instrument and filter combination using the tinytim software package. We assume a constant spectrum in Fν; the difference in the 90% encircled energy width of the PSF for a spectral index ranging from −2 to 0 is only 1%. We additionally correct for distortion in the ACS instrument, and use a sub-sampling factor of 2 for WFPC2 to appropriately account for the reduced pixel scale in the drizzled images.
In each observation, we fit the host galaxy image with a PSF-convolved Sérsic profile:

where n is the concentration parameter (n = 1 is equivalent to an exponential disk profile, while n = 4 is the de Vaucouleurs profile), κn ≈ 2n − 1/3 + 4/405n + 46/25515n2 is a constant that is coupled to the value of n (Ciotti & Bertin 1999), re is the effective radius, and Σe is the effective surface brightness in flux units. In the subsequent discussion, tables, and figures, we use surface brightness in units of mag arcsec−2, designated as μe.
In all cases, we fit the host galaxies with a single7 Sérsic profile and allow the parameters to vary freely. The resulting best-fit values of n, re, and μe, as well as the integrated AB magnitudes, are provided in Table 2. For host galaxies that are detected at a low signal-to-noise ratio (S/N), we find that a wide range of n values can account for the observed morphology. In these cases, we fit the host galaxies with n fixed at values of 1 and 4, and provide the results of both models in Table 2.
Table 2. Morphological Properties of Short GRB Host Galaxies
| GRB | Instrument | Filter | galfit | IRAF/ellipse | ||||||||
|---|---|---|---|---|---|---|---|---|---|---|---|---|
| na | re | rec | μeb | AB Magb | n | re | rec | μeb | ||||
| ('') | (kpc) | (AB mag arcsec−2) | ('') | (kpc) | (AB mag arcsec−2) | |||||||
| 050509b | ACS | F814W | 5.6 | 5.84 | 20.98 | 23.5 | 16.2 | 5.6 | 5.84 | 20.98 | 23.4 | |
| 050709 | ACS | F814W | 1.1 | 0.76 | 2.08 | 23.0 | 21.2 | 0.6 | 0.64 | 1.75 | 22.4 | |
| WFPC2 | F450W | 1.1 | 0.71 | 1.94 | 23.5 | 21.9 | 0.9 | 0.71 | 1.94 | 23.4 | ||
| 050724 | WFPC2 | F450W | 4 | 1.35 | 5.34 | 23.2 | 19.4 | 1.3 | 0.36 | 1.42 | 20.8 | |
| WFPC2 | F814W | 3.0 | 0.82 | 3.24 | 20.5 | 18.0 | 2.9 | 1.01 | 4.00 | 20.8 | ||
| 051210 | WFPC2 | F675W | 1 | 0.70 | 5.63 | 23.8 | 23.7 | 1.0 | 0.63 | 5.07 | 24.2 | |
| 4 | 2.38 | 19.14 | 26.3 | 22.8 | ||||||||
| 051221a | WFPC2 | F555W | 0.9 | 0.36 | 2.29 | 23.3 | 23.1 | 0.8 | 0.34 | 2.17 | 23.1 | |
| WFPC2 | F814W | 0.9 | 0.41 | 2.61 | 22.7 | 22.1 | 0.9 | 0.39 | 2.49 | 22.7 | ||
| 060121 | ACS | F606W | 1 | 0.36 | 2.89 | 25.9 | 27.1 | 1.4 | 0.67 | 5.39 | 27.2 | |
| 4 | 1.22 | 9.81 | 27.4 | 26.6 | ||||||||
| 060313 | ACS | F475W | 1 | 0.14 | 1.13 | 23.7 | 27.3 | 0.6 | 0.17 | 1.37 | 24.9 | |
| 4 | 0.32 | 2.57 | 26.2 | 26.7 | ||||||||
| ACS | F775W | 1 | 0.07 | 0.56 | 21.4 | 26.1 | 1.3 | 0.23 | 1.85 | 25.0 | ||
| 4 | 0.10 | 0.80 | 23.6 | 26.3 | ||||||||
| 061006 | ACS | F814W | 0.7 | 0.57 | 3.22 | 22.3 | 22.7 | 0.7 | 0.65 | 3.67 | 22.9 | |
| WFPC2 | F555W | 1 | 0.63 | 3.55 | 23.3 | 23.4 | 0.8 | 0.55 | 3.10 | 23.6 | ||
Notes. Results of morphological analysis performed with galfit and IRAF/ellipse (Section 3). aFor the Sérsic index n in galfit, exact values of 1 and 4 indicate a fit with n as a fixed parameter. bThese values have been corrected for Galactic extinction. cFor the hosts with unknown redshift (GRBs 051210, 060121, and 060313), we assume z = 1.
Download table as: ASCIITypeset image
The galfit models and residual images for all instrument/filter combinations are shown in Figures 1–9. Objects for which both n = 1 and n = 4 models provide an adequate fit are shown for both cases.
2.3.2. Radial Profiles from IRAF/ellipse
We use ellipse to generate elliptical isophotes for each host galaxy, with the center and ellipticity of each isophote allowed to vary.8 The resulting radial surface brightness profiles in units of AB mag arcsec−2 are shown in Figure 11. We fit each profile with a Sérsic model (Equation (1)) using n, re, and μe as free parameters. The best-fit values are listed in Table 2, and the resulting models are shown in Figure 11. We find adequate fits in all cases, although some host galaxies clearly exhibit radial complexity due to irregular structure and/or an edge-on orientation.

Figure 11. One-dimensional radial surface brightness profiles for short GRB host galaxies derived from IRAF/ellipse. The gray lines are Sérsic model fits (Equation (1)) to the surface brightness profiles. The results of the fits are listed in Table 2.
Download figure:
Standard image High-resolution image2.4. Astrometry
To determine the location of each short GRB relative to its host galaxy, we perform differential astrometry using optical and near-IR images of the afterglows.9 With the exception of GRB 050709, whose afterglow is directly detected in HST/ACS observations, we use ground-based images from Magellan, Gemini, and the VLT. The astrometric tie between the afterglow and host images is performed using point sources in common between the two images; the source of the afterglow image and the number of astrometric tie objects are listed in Table 3. In the case of ground-based to HST astrometry, we use a range of 15–85 common objects, with the number depending on the density of stellar sources in the field, the depth of the images, and the field of view. To determine the astrometric tie, we use the IRAF astrometry routine ccmap. We find that a second-order polynomial, with six free parameters corresponding to a shift, scale, and rotation in each coordinate, provides a robust astrometric tie in all cases. The resulting rms values are σGB→HST = 13–30 mas (Table 3).
Table 3. Short GRB Angular, Physical, and Host-normalized Offsets
| GRB | Instrument | Filter | z | Reference | No. | σGB→HST | σθ,GRB | σθ,gal | δR.A. | δDecl. | Offset | Offset | Offset |
|---|---|---|---|---|---|---|---|---|---|---|---|---|---|
| (mas) | (mas) | (mas) | ('') | ('') | ('') | (kpc) | (rea) | ||||||
| 050509b | ACS | F814W | 0.226 | SDSS | 10 | 30 | 3400 | 1.0 | +15.61 | +8.40 | 17.73 ± 3.4 | 63.7 ± 12.2 | 3.04 ± 0.58 |
| 3300 | 1.0 | +11.68 | +4.40 | 12.48 ± 3.3 | 44.8 ± 11.9 | 2.14 ± 0.57 | |||||||
| 050709 | ACS | F814W | 0.1606 | HST/ACS | 35 | 8 | 1.0 | 1.4b | +1.294 | −0.310 | 1.331 ± 0.010 | 3.64 ± 0.027 | 2.08 ± 0.02 |
| WFPC2 | F450W | HST/ACS | 12 | 14 | 1.0 | 4.7 | +1.306 | −0.360 | 1.355 ± 0.020 | 3.71 ± 0.055 | 1.91 ± 0.03 | ||
| ACS | F814W | Self | ... | ... | 1.0 | 1.4 | +1.329 | −0.310 | 1.365 ± 0.002 | 3.74 ± 0.005 | 2.13 ± 0.01 | ||
| 050724 | WFPC2 | F450W | 0.257 | Magellan/PANIC | 60 | 15 | 5.0 | 4.7c | −0.226 | −0.640 | 0.679 ± 0.025 | 2.69 ± 0.099 | 1.89 ± 0.07 |
| WFPC2 | F814W | Magellan/PANIC | 85 | 14 | 5.0 | 1.4 | −0.213 | −0.630 | 0.665 ± 0.020 | 2.63 ± 0.079 | 0.66 ± 0.02 | ||
| PANIC | Ks | Self | ... | ... | 5.0 | 1.0 | −0.253 | −0.650 | 0.697 ± 0.006 | 2.76 ± 0.024 | ... | ||
| 051210 | WFPC2 | F675W | >1.4 | 2MASS | 12 | 29 | 2900 | 8 | +2.89 | +0.50 | 2.93 ± 2.9 | 24.9 ± 24.6 | 4.65 ± 4.60 |
| 1700 | 8 | +3.45 | −2.40 | 4.20 ± 1.7 | 35.7 ± 14.4 | 6.67 ± 2.70 | |||||||
| 051221 | WFPC2 | F555W | 0.5465 | Gemini-N/GMOS | 45 | 23 | 2.5 | 3.1 | −0.287 | +0.090 | 0.301 ± 0.029 | 1.92 ± 0.18 | 0.88 ± 0.08 |
| WFPC2 | F814W | Gemini-N/GMOS | 45 | 24 | 2.5 | 3.1 | −0.330 | +0.090 | 0.342 ± 0.030 | 2.18 ± 0.19 | 0.88 ± 0.08 | ||
| 060121 | ACS | F606W | ... | Gemini-N/GMOS | 25 | 18 | 16 | 12 | −0.115 | +0.030 | 0.119 ± 0.046 | 0.96 ± 0.37d | 0.18 ± 0.07 |
| 060313 | ACS | F475W | ... | Gemini-S/GMOS | 30 | 30 | 19 | 19.4 | +0.354 | +0.040 | 0.356 ± 0.068 | 2.86 ± 0.55d | 2.09 ± 0.40 |
| ACS | F775W | Gemini-S/GMOS | 15 | 30 | 19 | 13.2 | +0.280 | +0.050 | 0.284 ± 0.062 | 2.28 ± 0.50d | 1.23 ± 0.23 | ||
| 060502b | ACS | F814W | USNO-B | 47 | 120 | 3700 | ...e | ... | ... | ... | ... | ... | |
| 5800 | ...e | ... | ... | ... | ... | ... | |||||||
| 061006 | ACS | F814W | 0.4377 | VLT/FORS1 | 75 | 17 | 21 | 4.9 | −0.155 | −0.170 | 0.230 ± 0.043 | 1.30 ± 0.24 | 0.35 ± 0.07 |
| WFPC2 | F555W | VLT/FORS1 | 45 | 20 | 21 | 11 | −0.171 | −0.190 | 0.256 ± 0.052 | 1.44 ± 0.29 | 0.46 ± 0.10 | ||
| 061201 | ACS | F814W | ... | VLT/FORS2 | 24 | 13 | 41 | ...e | ... | ... | ... | ... | ... |
| ACS | F606W | ... | VLT/FORS2 | 24 | 13 | 41 | ...e | ... | ... | ... | ... | ... |
Notes. Projected angular, physical, and host-normalized offsets for the short GRBs with HST observations. aValues for re are from ellipse (Table 2). bSystematic uncertainty in host center is 50 mas. cSystematic uncertainty in host center is 20 mas. dAssuming z = 1. eWe do not claim a unique host galaxy identification for this burst.
Download table as: ASCIITypeset image
We next consider the uncertainty in the afterglow position from each ground-based image. The centroiding accuracy depends on the size of the PSF and the S/N of the afterglow detection, σθ = θFWHM/(S/N). We determine σθ,GRB for each GRB using the SExtractor program10 (Table 3). In the case of GRBs 050724 and 051221, we find that σθ,GRB is significantly smaller than σGB→HST; for GRBs 060121, 060313, and 061006 the two sources of uncertainty are comparable; and for GRB 061201, σθ,GRB dominates. The afterglows of GRBs 050509b, 051210, and 060502b have only been detected in X-rays, with the Swift X-ray Telescope (XRT), and as a result their positional uncertainty is σθ,GRB ∼ 17–58 (Table 3). We note that the XRT positions from the catalogs of Butler (2007) and Evans et al. (2009) exhibit relative offsets of 56 (GRB 050509b), 30 (GRB 051210), and 29 (GRB 060502b) suggesting that the true positional uncertainties (including systematics) are larger than their quoted statistical uncertainties.
The final source of uncertainty in the relative position of the GRB and host galaxy is the centroiding accuracy of the host in the HST images. To determine this uncertainty, we again use SExtractor. The resulting values of σθ,gal are listed in Table 3. We find that for GRBs 050724, 051221, and 061006 the host centroid uncertainty is smaller than both σGB→HST and σθ,GRB, while for GRBs 060121 and 060313 σθ,gal is comparable to σθ,GRB. The combined offset uncertainties are listed in Table 3.
A much more accurate relative position is available for GRB 050709 since the afterglow was detected in HST/ACS images (Fox et al. 2005). The limiting factor is thus σθ for the afterglow and host. We find from the first HST/ACS observation (2005 July 15.6 UT) that σθ,GRB = 1 mas, while σθ,gal = 1.4 mas. In addition, we also astrometrically tie the final epoch of ACS imaging and the WFPC2 image to the first epoch. Since the afterglow is no longer detected in these images, this allows us to study the burst environment. For the final ACS image we find σHST→HST = 8 mas, while for the WFPC2 image we find σHST→HST = 14.5 mas. These uncertainties clearly dominate over the centroiding errors of the afterglow and host galaxy. We do note, however, that the complex morphology of the host galaxy (Section 3) introduces a systematic uncertainty in the definition of the host "center." By varying the signal-to-noise threshold in SExtractor, we find that the centroid of the host shifts by as much as 50 mas, which dominates over the statistical uncertainty in the source position.
Similarly, we find a more accurate offset for GRB 050724 from a detection of the afterglow and host in ground-based near-IR images (Berger et al. 2005). The combined afterglow and host centroid uncertainty in these images is about 6 mas, compared to a total uncertainty of 20–25 mas for the HST images.
2.5. Host Light Distribution
To determine the brightness of the GRB location relative to the host light distribution, we follow the methodology of Fruchter et al. (2006) and Kelly et al. (2008) and calculate from each galaxy image the fraction of total light in pixels fainter than the afterglow position. Six bursts have differential astrometric positions of better than 1 pixel (050709, 050724, 051221a, 060121, 060313, and 061006; Table 3). For each image, we create an intensity histogram of a 5'' × 5'' region centered on the host galaxy and determine a 1σ cutoff level for the host by fitting a Gaussian profile to the sky brightness distribution (equivalent to a S/N cutoff of 1). We then plot the pixel flux distribution above the appropriate cutoff level for a region surrounding the host, and determine the fraction of light in pixels fainter than the afterglow pixel; see Table 4.
Table 4. Short GRB Fractional Flux
| GRB | Instrument | Filter | Fractional Flux |
|---|---|---|---|
| 050709 | WFPC2 | F450W | 0 |
| ACS | F814W | 0.09 | |
| 050724 | WFPC2 | F450W | 0.03 |
| WFPC2 | F814W | 0.33 | |
| 051221 | WFPC2 | F555W | 0.54 |
| WFPC2 | F814W | 0.65 | |
| 060121 | ACS | F606W | 0.41 |
| 060313 | ACS | F475W | 0.04 |
| ACS | F775W | 0 | |
| 061006 | WFPC2 | F555W | 0.56 |
| ACS | F814W | 0.63 |
Note. Fraction of host galaxy light in pixels fainter than the GRB position.
Download table as: ASCIITypeset image
3. MORPHOLOGICAL ANALYSIS
Using the results of the galfit analysis and the radial surface brightness profiles, we first classify the short GRB hosts in terms of their Sérsic n values. From the galfit analysis, we find that three hosts (GRBs 050709, 051221a, and 061006) are best modeled with n ≈ 1, corresponding to an exponential disk profile, while two hosts (GRBs 050509b and 050724) are best modeled with n ≈ 3 and ≈5.6, respectively, typical of elliptical galaxies. We note that GRB 050724 possibly exhibits weak spiral structure, which may explain the resulting value of n ≈ 3 (see Figure 3 and Malesani et al. 2007), but this putative spiral structure is clearly sub-dominant relative to the elliptical structure. The final three hosts (GRBs 051210, 060121, and 060313) are equally well modeled in galfit with a wide range of n values, and we provide results for both n = 1 and n = 4 in Table 2.
We find identical results using Sérsic model fits to the one-dimensional radial surface brightness profiles generated with ellipse (Figure 11 and Table 2). However, with this approach we find best-fit values of n ∼ 1 for the three host galaxies with ambiguous galfit results, suggesting that they are indeed better modeled as exponential disks. We, therefore, conclude that of the eight short GRB host galaxies studied here only two can be robustly classified as elliptical galaxies based on their morphology. A similar fraction was determined independently from spectroscopic observations (Berger 2009). The distribution of n values is shown in Figure 12.

Figure 12. Effective radii for the short GRB hosts with HST observations plotted as a function of their Sérsic n values. We use the results of the IRAF/ellipse analysis; see Figure 11 (open squares designate hosts for which galfit models with n = 1 and n = 4 provide an equally good fit). Also shown are the data for long GRB hosts based on HST observations from the sample of Wainwright et al. (2007). The hosts of GRBs 050509b and 050724 have n values typical of elliptical galaxies, but the remaining hosts have a similar distribution to that of long GRBs (i.e., a median of n ∼ 1, or an exponential disk profile). On the other hand, the hosts of short GRBs are larger by about a factor of 2 than the hosts of short GRBs, in agreement with their higher luminosities.
Download figure:
Standard image High-resolution imageAs can be seen from the galfit results, the Sérsic models of the two elliptical hosts exhibit significant residuals (Figures 1 and 3). This is a well-known effect for bright elliptical galaxies, which generally require a multi-parameter power law plus Sérsic fit that accounts for a flatter core than expected in the de Vaucouleurs model (Trujillo et al. 2004). Since we are here mainly interested in the distribution of n values and a comparison to long GRB hosts, we retain the simple Sérsic formulation.
We also find significant residuals for a one-component Sérsic fit of the host galaxy of GRB 050709, which has an irregular morphology dominated by an exponential profile (Figure 2). This is the only clearly irregular galaxy in the sample. Finally, we find that the hosts of GRBs 051210, 060121, and 061006 exhibit significant bulges, clearly seen in their radial surface brightness profiles (Figure 11). For the host of GRB 061006, which was observed in two filters, the bulge component is more significant in the F814W filter than in the F555W filter, as expected for an older stellar population; the burst appears to coincide with this bulge component (Figure 9).
The galfit and radial profile fits also yield values of the effective radius, re, for each host galaxy. We find a range of ≈02–58, corresponding to physical scales11 of about 1.4–21 kpc. The smallest effective radius is measured for the host of GRB 060313, while the host of GRB 050509b has the largest effective radius. The median value is re ≈ 3.5 kpc. We adopt the best-fit values from the radial surface brightness profiles, and plot the resulting distribution, as well as re as a function of n, in Figure 12.
Finally, the effective surface brightness values range from μe ≈ 21 to ≈27 AB mag arcsec−2. The galaxy with the highest surface brightness is the host of GRB 050724, while the lowest surface brightness is measured for the host of GRB 060121. The integrated magnitudes range from about 16.3 AB mag (GRB 050509b) to 26.4 AB mag (GRB 060313).
3.1. Comparison to Long GRB Host Galaxies
A comprehensive morphological analysis of long GRB host galaxies using HST observations with the STIS, WFPC2, and ACS instruments has been carried out by Conselice et al. (2005) and Wainwright et al. (2007). In Figure 12, we compare the values of n and re measured for long GRB hosts by Wainwright et al. (2007) to the values measured here for short GRB hosts. Two clear trends emerge from this comparison. First, all long GRB hosts have n ≲ 2.5, and the median value for the population is 〈n〉 ≈ 1.1 (Wainwright et al. 2007). Thus, all long GRB hosts are morphologically classified as exponential disks, while two of the eight short GRB hosts studied here exhibit de Vaucouleurs profiles. However, for the hosts with n ≲ 2, the distributions of n values for both populations appear to be similar.
Second, short GRB hosts have larger effective radii, with 〈re〉 ≈ 3.5 kpc, compared to 〈re〉 ≈ 1.7 kpc for long GRB hosts (Wainwright et al. 2007). A Kolmogorov–Smirnov (K–S) test indicates that the probability that the short and long GRB hosts are drawn from the same underlying distribution of host galaxy effective radii is only 0.04. If we remove from the sample GRBs 050509b and 051210 (which have only XRT positions), we find that the K–S probability is still only 0.09. Thus, we conclude with high significance that short GRB host galaxies are systematically larger than long GRB hosts, and that this result is not affected by host associations based on XRT positions. The larger sizes of short GRB hosts are expected in the context of the galaxy size–luminosity relation (e.g., Freeman 1970). We recently showed that short GRB hosts are systematically more luminous than long GRB hosts by about ΔMB ≈ 1.2 mag (Berger 2009) and therefore their sizes are expected to be correspondingly larger.
An additional striking difference between the hosts of long and short GRBs is the apparent dearth of interacting or irregular galaxies in the short GRB sample. Of the eight host galaxies studied here, we find only one irregular galaxy (GRB 050709) and none that appear to be undergoing mergers. In contrast, the fraction of long GRB hosts with an irregular or merger/interaction morphology is about 30%–60% (Wainwright et al. 2007). The interpretation for this high merger/interaction fraction in the long GRB sample is that such galaxies are likely undergoing intense star formation activity triggered by the merger/interaction process, and are therefore suitable sites for the production of massive stars. The lack of morphological merger signatures in the short GRB sample indicates that if any of the hosts have undergone significant mergers in the past, the delay time between the merger and the production of a short GRB is ≳109 yr (e.g., Barnes & Hernquist 1992).
4. OFFSETS
We next turn to an analysis of short GRB offsets relative to the centers of their host galaxies. Based on the astrometric tie of the HST host observations to ground-based afterglow observations, we find that the projected offsets are in the range of ≈012–177 (Table 3). The corresponding projected physical offsets are about 1–64 kpc, with a median value of about 3 kpc. The largest offsets are measured for GRBs 050509b and 051210, but these are based on Swift/XRT positions with statistical uncertainties of about 12 and 18 kpc, respectively (and possibly larger if we consider systematic uncertainties; Section 2.4). If we consider only the bursts with sub-arcsecond afterglow positions, we find that the largest offset is 3.7 kpc (GRB 050709), and that the median offset for the six bursts is 2.2 kpc. In the case of GRB 061201, the host association remains ambiguous (see Appendix B), but even for the nearest detected galaxy the offset is about 14.2 kpc. The obvious caveat is that an undetected fainter host, with ≳25.5 AB mag, may be located closer to the GRB position.
To investigate the offset distribution in greater detail, we supplement the values measured here with offsets for GRBs 070724, 071227, and 090510 from ground-based observations (Berger et al. 2009; Rau et al. 2009). In the case of GRBs 070724 and 071227, the optical afterglows coincide with the disks of apparent edge-on spiral galaxies (Berger et al. 2009; D'Avanzo et al. 2009). The offsets of the three bursts are 4.8, 14.8, and 5.5 kpc, respectively (Berger et al. 2009; Rau et al. 2009). For GRB 071227, we calculate the relative offset from our Magellan/IMACS observations and find a total (σθ,GRB + σθ,gal) uncertainty of 65 mas, corresponding to 0.34 kpc at the redshift of the host.12
There are seven additional events with optical afterglow identifications. Of these bursts, two (070707 and 070714b) coincide with galaxies (Piranomonte et al. 2008; Graham et al. 2009), but their offsets have not been measured by the respective authors. Based on the claimed coincidence, we conservatively estimate an offset of ≲05, corresponding13 to ≲4 kpc. Two additional bursts (070809 and 080503) do not have coincident host galaxies to deep limits, but the nearest galaxies are located about 6.5 and 20 kpc from the afterglow positions, respectively14 (Perley et al. 2008, 2009). For the final three bursts (080905, 090305, and 090426), no deep host galaxy searches exist in the literature.
In addition to the bursts with sub-arcsecond positions, several hosts have been identified within XRT error circles in follow-up observations (GRBs 060801, 061210, 061217, 070429b, 070729, and 080123; Berger et al. 2007; Berger 2009), but in all of these cases the offsets are consistent with zero, or may be as large as ∼30 kpc (e.g., Berger et al. 2007). For example, the offsets for GRBs 060801, 061210, and 070429b are 19 ± 16 kpc, 11 ± 10 kpc, and 40 ± 48 kpc. We use 30 kpc as a typical upper limit on the offset for these six events. We note that no follow-up observations are available in the literature for most short GRBs with X-ray positions from 2008 to 2009. Finally, about 1/4–1/3 of all short GRBs discovered to date have only been detected in γ-rays, precluding a unique host galaxy association and an offset measurement.
The cumulative distribution of projected physical offsets for the GRBs with HST observations from this work, supplemented by the bursts with offsets or limits based on optical afterglow positions (070707, 070714b, 070724, 070809, 071227, 080503, and 090510) is shown in Figure 13. Also shown is the differential probability distribution, P(δr)d(δr), taking into account the non-Gaussian errors on the radial offsets (see discussion in Appendix B of Bloom et al. 2002). We find that the median for this sample is about 5 kpc.

Figure 13. Projected physical offsets for short GRBs (black) and long GRBs (gray; Bloom et al. 2002). The top panel shows a cumulative distribution, while the bottom panel shows the differential distribution taking into account the non-Gaussian errors on the offsets. The arrows in the bottom panel mark the median value for each distribution. The median value for short GRBs, ≈5 kpc, is about a factor of 5 times larger than for long GRBs. The arrows in the top panel exhibit the most robust constraints on the offset distribution (Section 4), taking into account the fraction of short GRBs with only γ-ray positions, as well as short GRBs for which hosts have been identified within XRT error circles (thereby providing a typical range of ∼0–30 kpc). Also shown in the top panel are predicted offset distributions for NS–NS binary mergers in Milky Way type galaxies based on population synthesis models. We find good agreement between the observed distribution and models, as well as between the robust constraints and models.
Download figure:
Standard image High-resolution imageAs evident from the discussion above, this is not a complete offset distribution; roughly an equal number of short GRBs have only limits or undetermined offsets due to their detection in just the X-rays or γ-rays.15 Taking these events into account, our most robust inferences about the offset distribution of short GRBs are as follows.
- 1.At least 25% of all short GRBs have projected physical offsets of ≲10 kpc.
- 2.At least 5% of all short GRBs have projected physical offsets of ≳20 kpc.
- 3.At least 50% of all short GRBs have projected physical offsets of ≲30 kpc; this value includes the upper limits for the hosts identified within XRT error circles.
These robust constraints are shown in Figure 13.
Using the observed distribution and the robust constraints outlined above, we now provide a comparison with predicted distributions for NS–NS binaries in Milky Way type galaxies (Bloom et al. 1999; Fryer et al. 1999; Belczynski et al. 2006), appropriate for the observed luminosities of short GRB host galaxies (Berger 2009). We find good agreement between the observed distribution and those predicted by Bloom et al. (1999) and Belczynski et al. (2006). The offset distribution of Fryer et al. (1999), with a median of about 7 kpc, predicts larger offsets and therefore provides a poorer fit to the observed distribution, which has a median of about 5 kpc. However, all three predicted distributions accommodate the offset constraints. In particular, they predict about 60%–75% of the offsets to be ≲10 kpc, about 80%–90% to be ≲30 kpc, and about 10%–25% of the offsets to be ≳20 kpc. Thus, the projected physical offsets of short GRBs are consistent with population synthesis predictions for NS–NS binaries. However, the observations are also consistent with partial contribution from other progenitor systems with no expected progenitor kicks, such as WD–WD binaries.
4.1. Host-normalized Offsets
To compare the offsets in a more uniform manner, we normalize the measured values by re for each host galaxy. We use the re values measured from the one-dimensional radial surface brightness profiles from ellipse (see Figure 14 and Table 3) and find values ranging from about 0.2 re for GRB 060121 to 6.7 ± 2.7 re for the Evans et al. (2009) XRT position of GRB 051210. The Butler (2007) position for GRB 051210, however, leads to an offset of 4.65 ± 4.60 re, consistent with a negligible offset. For the subset of six bursts with optical afterglow positions and secure host associations, four are located within 1 re, while the remaining two bursts are located at about 2 re (Figure 14). GRB 050509b, which has the largest physical offset, has a normalized offset of 2–3 re, depending on which XRT position is used. Thus, with the exception of the ambiguous case of GRB 061201, we find that all of the available offsets are consistent with ≲2 re. The large additional sample of physical offsets that we used above cannot be easily translated to host-normalized offsets at the present since none of the hosts have been observed with HST, thereby precluding a robust morphological analysis. This provides an impetus for future HST observations.

Figure 14. Host-normalized offsets in right ascension and declination for the short GRBs in our HST sample (black; open symbols mark the GRBs with X-ray positions, 050509b and 051210). Also shown are the offsets for long GRBs from the sample of Bloom et al. (2002). The circle marks an offset of 1 re. About half of all long GRBs have offsets of ≲1 re, and we find a similar result for short GRBs.
Download figure:
Standard image High-resolution imageThe differential probability distribution of host-normalized offsets for our HST sample, taking into account the non-Gaussian errors, is shown in Figure 15. We find that the median value for all eight bursts is ≈1 re. Moreover, ≲20% of the probability distribution is at large offsets of ≳2.5 re.

Figure 15. Probability distributions of the host-normalized offsets of short GRBs (black) and long GRBs (gray; Bloom et al. 2002). For each burst, we include the host-normalized offset taking into account the non-Gaussian errors. The arrows mark the median value of each distribution, and the inset shows the cumulative distribution.
Download figure:
Standard image High-resolution image4.2. Comparison to Long GRB Host Galaxies
We compare our observed short GRB offsets with those of long GRBs from the sample of Bloom et al. (2002) in Figures 13–15. The offset distribution of long GRBs has been used to argue for a massive star progenitor population, and against NS–NS binaries (Bloom et al. 2002). The offset distribution for short GRBs is clearly shifted to larger physical scales. In particular, the median offset for the long GRBs is 1.1 kpc, about a factor of five times smaller than the median value for short GRBs. Similarly, no long GRB offsets are larger than about 7 kpc, whereas at least some short GRBs appear to have offsets in excess of 15 kpc.
However, the distinction between the two offset distributions is significantly reduced when we take into account the systematically larger sizes of short GRB host galaxies (Figure 12). The median normalized offset for long GRBs is about 0.8 re, compared to about 1 re for short GRBs. Similarly, 20% of the long GRB cumulative distribution has offsets of ≳2.5 re, identical to the statistics for the short GRB offsets. Indeed, as can be seen from Figure 15, the cumulative host-normalized offset distributions for long GRBs and short GRBs with HST observations are nearly identical.
In the context of NS–NS binary progenitors, the close similarity in the normalized offset distributions can be interpreted to mean that most systems likely remain bound to their hosts (rather than ejected into the intergalactic medium), and/or have a relatively short delay time. These conclusions are tentative due to the small number of events with host-normalized offsets, but they can be further tested with future HST observations.
5. LIGHT DISTRIBUTION ANALYSIS
In addition to the offset analysis in the previous section, we study the local environments of short GRBs using a comparison of their local brightness to the host light distribution. This approach is advantageous because it is independent of galaxy morphology, and does not suffer from ambiguity in the definition of the host center (see Fruchter et al. 2006). We note that for the overall regular morphology of short GRB hosts the definition of the host center is generally robust, unlike in the case of long GRBs (Fruchter et al. 2006; Wainwright et al. 2007). On the other hand, this approach has the downside that it requires precise pixel-scale positional accuracy. In our sample, this is the case for only six short bursts.
The fraction of host light in pixels fainter than the afterglow pixel brightness for each host/filter combination is summarized in Table 4. The cumulative light distribution histogram is shown in Figure 16. The shaded histogram represents the range defined by the dual filters for five of the six bursts. We find that the upper bound of the distribution is defined by the blue filters, indicating that short GRBs trace the rest-frame optical light of their hosts better than the rest-frame ultraviolet. This indicates that short GRB progenitors are likely to be associated with a relatively old stellar population, rather than a young and UV bright population.

Figure 16. Cumulative distribution of fractional flux at the location of short GRBs relative to their host light. For each burst, we measure the fraction of host light in pixels fainter than the GRB pixel location. The shaded area is defined by the results for the two available filters for each short GRB. Also shown are data for long GRBs (dark gray line) and for core-collapse and Type Ia SNe (light gray lines) from Fruchter et al. (2006) and Kelly et al. (2008). The dashed line marks the expected distribution for objects, which track their host light distribution. Short GRBs appear to under-represent their host light, while long GRBs tend to be concentrated in the brightest regions of their hosts (Fruchter et al. 2006).
Download figure:
Standard image High-resolution image
The overall distribution has a median value of ≈0.1–0.4 (red); namely, only in about one-quarter of the cases, 50% of the host light is in pixels fainter than at the GRB location. Thus, the overall distribution of short GRB locations under-represents the host galaxies' light distribution. This is also true in comparison to the distribution for core-collapse SNe, which appear to track their host light (Fruchter et al. 2006), and even Type Ia SNe, which have a median of about 0.4 (Kelly et al. 2008). Thus, the progenitors of short GRBs appear to be more diffusely distributed than Type Ia SN progenitors.
5.1. Comparison to Long GRB Host Galaxies
An extensive analysis of the brightness distribution at the location of long GRBs has been carried out by Fruchter et al. (2006). These authors find that long GRBs are more concentrated on the brightest regions of their hosts than expected from the light distribution of each host. In particular, they conclude that the probability distribution of GRB positions is roughly proportional to the surface brightness squared. As can be seen from Figure 16, short GRBs have a significantly more diffuse distribution relative to the host light than long GRBs. In particular, for the latter, the median light fraction is about 0.85 compared to about 0.25 ± 0.15 for the short GRBs.
6. DISCUSSION AND IMPLICATIONS
Our extensive analysis of short GRB host galaxy morphologies and the burst local environments has important implications for the progenitor population. We address in particular the popular NS–NS merger model, as well as delayed magnetar formation via WD–WD mergers or WD accretion-induced collapse (Metzger et al. 2008).
6.1. Morphology
From the morphological analysis, we find continued evidence that the bulk of short GRB host galaxies (∼3/4) are late-type galaxies, in agreement with results from spectroscopic observations (Berger 2009). Moreover, as demonstrated by the systematic differences in luminosity, star formation rates, and metallicities between the star-forming hosts of long and short GRBs (Berger 2009), we find here that short GRB hosts are systematically larger than long GRB hosts. These results indicate that the progenitors of the two GRB classes select different environments. The higher luminosities, larger sizes, and lower specific star formation rates of short GRB hosts suggest that their rate of occurrence is tied to galactic mass rather than to star formation activity. This result is in broad agreement with old progenitor populations such as NS–NS, NS–BH, or WD–WD binaries, but it indicates that the bulk of short GRB progenitors are not young magnetars. This conclusion is also supported by the dearth of merger signatures, which point to delays of ≳109 yr relative to any merger-triggered star formation episodes.
6.2. Offsets
The differential offsets measured here from the HST observations provide the most precise values to date for short GRBs, with a total uncertainty of only ∼10–60 mas, corresponding to ∼30–500 pc. We find that none of the offsets are smaller than ∼1 kpc, while this is the median offset for long GRBs. On the other hand, a substantial fraction of the measured offsets are only a few kpc. The median offset for the HST observations supplemented by ground-based data is about 5 kpc (Figure 13), about five times larger than for long GRBs.
As discussed in detail in Section 4, the observed offset distribution is incomplete. About 1/4–1/3 of all short GRBs have only γ-ray positions (∼1'–3'), and a similar fraction have only XRT positions, which generally lead to a range of offsets of ∼0–30 kpc. Taking these limitations into account, we find that the most robust constraints on the offset distribution are that ≳25% of all short GRBs have offsets of ≲10 kpc, and that ≳5% have offsets of ≳20 kpc. Both the observed offset distribution and these constraints are in good agreement with predictions for the offset distribution of NS–NS binaries in Milky Way type galaxies (Bloom et al. 1999; Fryer et al. 1999; Belczynski et al. 2006). However, at the present they cannot rule out at least a partial contribution from other progenitor systems such as delayed magnetar formation and even young magnetar flare. The apparent existence of large offsets in the sample suggests that these latter models are not likely to account for all short GRBs.
In contrast to the larger physical offsets of short GRBs, we find that the distribution of offsets normalized to the host galaxy effective radii exhibits much better agreement between long and short GRBs (Figure 15). The medians of the two distributions are similar (1 vs. 0.8 re for short and long GRBs, respectively), and both populations have ≈20% probability for offsets of ≳2.5 re. Naturally, due to the lack of HST observations for short GRBs from 2007 to 2009, the sample for which this analysis is possible is smaller than the sample with physical offsets. Thus, further HST observations of existing and future short GRB hosts are essential in order to determine whether the broad similarity in host-normalized offsets is robust. We stress that in the context of comparing short GRBs with various progenitor populations and with long GRBs, host-normalized offsets are the more relevant quantity. For example, the host-normalized distributions for massive stars in small and large galaxies will be similar even though their physical offsets will differ. We stress that population synthesis modelers should include an appropriate distribution of host galaxy sizes, and thereby provide predictions for host-normalized offsets.
In the context of implications for the progenitor population, a recent study of short GRB physical offsets by Troja et al. (2008) led these authors to claim that short GRBs with extended X-ray emission have systematically smaller offsets, possibly due to a systematic difference in the progenitors. Our HST sample includes three short GRBs with strong extended emission (050709, 050724, and 061006), and one GRB (060121) with possible extended emission (4.5σ significance; Donaghy et al. 2006). The physical offsets of these bursts are about 3.7, 2.7, 1.3, and 1 kpc, respectively, leading to a mean offset of about 2.2 kpc. The physical offsets of the bursts without extended emission, but with precise afterglow positions (051221, 060313, and 061201) are 2.0, 2.3, and 14.2 or 32.5 kpc, respectively. The two events with no extended emission and with XRT positions (050509b and 051210) have offsets of about 54 ± 12 and 28 ± 23 kpc, respectively. If we include the ground-based sample with optical afterglow positions (see Section 4), we find that the bursts with apparent extended emission (070714b, 071227, 080513, and 090510; Barbier et al. 2007; Sakamoto et al. 2007; Ukwatta et al. 2009; Perley et al. 2009) have offsets of ≲4, 14.8, ∼20, and ∼5.5 kpc, while the bursts without extended emission (070724 and 070809) have offsets of 4.8 and ∼6.5 kpc. Thus, based on the sample of events with sub-arcsecond positions, we find that 6/8 bursts with extended emission have offsets of ≲5 kpc and 2/8 have likely offsets of ∼15–20 kpc. In the sample without extended emission, we find that 4/5 have offsets of ≲6 kpc and 1/5 has a likely offset of ∼14–32 kpc. Thus, we conclude that there is no significant difference in the two offset distributions.
The inclusion of events with only XRT positions does not change this conclusion. In particular, of the subset with no extended emission only GRB 050509b is likely to have a significant offset, while GRBs 051210, 060801, and 070429b have offsets (28 ± 23, 19 ± 16, and 40 ± 48 kpc, respectively) that are consistent with zero. Similarly, GRB 061210 with extended emission has an offset of 11 ± 10 kpc. An examination of the sample of Troja et al. (2008) reveals that their claim that short GRBs without extended emission have systematically larger offsets rests on four events in particular: GRBs 050509b, 060502b, 061217, and 061201. As noted above, GRBs 050509b and 061201 indeed appear to have substantial offsets,16 but so do GRBs 071227 and 080503 with extended emission and offsets of about 15–20 kpc. Next, the large offset for GRB 060502b relies on its claimed association with an elliptical galaxy 70 ± 16 kpc from the XRT position (Bloom et al. 2007). However, the XRT error circle contains additional galaxies with negligible offsets (Berger et al. 2007). Finally, we note that the offset for GRB 061217 is unreliable due to a substantial discrepancy of about 33'' in the XRT positions from Butler (2007) and Evans et al. (2009). A continued investigation of the difference between short GRBs with and without extended emission will greatly benefit from the use of host-normalized offsets.
6.3. Light Distribution
In addition to projected offsets relative to the host center, we find that the locations of the short GRBs with HST imaging and sub-arcsecond positions are more diffusely distributed relative to their host light than long GRBs. In particular, we find that short GRB positions under-represent their host light, even in comparison to core-collapse and Type Ia SNe. This result is likely an upper limit on the brightness of short GRB locations since only the subset of events with optical afterglow positions can be studied with this approach. Thus, short GRBs arise from a population of events with a more diffuse distribution than massive stars and Type Ia SN progenitors. This result also indicates that the bulk of the progenitors of long and short GRBs cannot both be magnetars.
There are currently 10 known short GRBs with optical afterglows for which HST observations will enable a similar analysis. This is twice the number of the current sample, and we can therefore make significant progress in understanding the relation of short GRB environments to the overall distribution of light in their host galaxies with future observations.
7. CONCLUSIONS
We presented the first comprehensive analysis of short GRB HST observations, and used these data to extract the morphological properties of the host galaxies, the projected physical and host-normalized GRB offsets, and the brightness at the location of the bursts relative to the overall light distribution of their hosts. The main conclusions of our analysis are as follows.
- 1.The majority of short GRB hosts are consistent with or have exponential surface brightness profiles, typical of late-type galaxies. This conclusion is in good agreement with results from spectroscopic observations that reveal star formation activity in ∼3/4 of short GRB hosts (Berger 2009).
- 2.The host galaxies of short GRBs are on average larger by about a factor of 2 than the hosts of long GRBs.
- 3.The observed short GRB offset distribution extends from ∼1 to 50 kpc, with a median of about 5 kpc. Including the short GRBs with only γ-ray or X-ray positions, we find that ≳25%of all events have offsets of ≲10 kpc, and ≳5%have offsets of ≳20 kpc. A additional, though softer, limit is that ≳50% have offsets of ≲30 kpc.
- 4.The observed physical offset distribution and the robust constraints compare favorably with the predicted distribution for NS–NS binaries. However, they do not rule out at least a partial contribution from other progenitors systems such as WD–WD binaries.
- 5.We find no convincing evidence that short GRBs with extended emission have smaller physical offsets than those without extended emission. In both sub-samples, we find examples of both small offsets (∼few kpc) and possibly large offsets (tens of kpc).
- 6.The distribution of host-normalized offsets for the subset of short GRBs with HST observations is nearly identical to that of long GRBs. This is due to the systematically larger size of short GRB hosts, and indicates that a comparison with long GRBs and progenitor models will benefit from the use of host-normalized (rather than physical) offsets.
- 7.The locations of short GRBs with sub-arcsecond positions and HST imaging under-represent the overall light distribution of their hosts, but less so in the red. This result differs substantially from long GRBs, core-collapse SNe, and even Type Ia SNe.
The results derived in this paper are based mainly on a small sample of short GRBs (10 events) from 2005 to 2006. Seven of these objects have precise positions based on optical afterglow detections. Ten additional events with precise afterglow positions, and a similar number with XRT positions (some of which with identified hosts), are now available for a similar study. It is essential to observe this existing sample, as well as new events from Swift and Fermi, with the refurbished HST using the ACS and WFPC3 instruments. In conjunction with constraints on the progenitor population from the redshift distribution (Berger et al. 2007) and spectroscopic studies of the host galaxies (Berger 2009), the continued use of high angular resolution imaging will provide crucial insight into the nature of the progenitors and the potential for multiple populations.
APPENDIX A: THE HOST GALAXY OF GRB 060313
We present the first host galaxy association for GRB 060313, using HST/ACS observations in the F475W and F775W filters. The offset between the GRB position (determined from Gemini-South observations; Berger et al. 2007) and the galaxy center is about 032 (Table 3). The galaxy brightness is m(F475W) = 26.4 AB mag and m(F775W) = 25.6 AB mag (Table 1). The probability of chance coincidence at this offset and galaxy brightness is only about 3 × 10⁻³ (Beckwith et al. 2006). We thus conclude that this galaxy is the likely host of GRB 060313.
APPENDIX B: POSSIBLE HOST GALAXIES OF GRB 061201
The HST observations of GRB 061201 and its environment are shown in Figure 10. We explore two possibilities for the host galaxy. First, the burst is located 162 (32.5 kpc) from a relatively bright galaxy at z = 0.111 (marked "A" in Figure 10; Berger 2006; Stratta et al. 2007), for which we measure m(F606W) = 18.17 and m(F814W) = 17.82 AB mag. Second, we identify from the HST/ACS observations a second, fainter galaxy (marked "B" in Figure 10) located 18 from the GRB position, and with m(F606W) = 25.34 and m(F814W) = 25.03 AB mag. The redshift of this galaxy is not known, but assuming z ≳ 1 the inferred projected offset is 14.2 kpc. The probability of chance coincidence for both galaxies is about 20% (Beckwith et al. 2006). We therefore do not claim a unique host galaxy association for this burst, and stress that both galaxies should be considered as potential hosts. Deeper HST observations may also uncover an underlying host.
APPENDIX C: POSSIBLE HOST GALAXIES OF GRB 060502B
The HST observations of GRB 060502b and its environment are shown in Figure 8. Previously, Bloom et al. (2007) claimed that the host is likely an early type galaxy at z = 0.287 located about 70 kpc away from the burst XRT position. These authors also note the presence of fainter objects within the XRT error circle. A galaxy with R ≈ 25.2 mag was also found by Berger et al. (2007). In the combined HST/ACS/F814W, we find six faint galaxies within the XRT error circles of GRB 060502b (Figure 8). These galaxies have the following AB magnitudes: 27.5 (B), 25.9 (C), 27.2 (D), 26.1 (E), 24.8 (F), and 25.7 (G). The probability of chance coincidence for these galaxies within the XRT error circles is of the order of unity.
Footnotes
- 3
We do not repeat the analysis for GRB 080503 since no convincing host galaxy was identified (Perley et al. 2009). Future HST ACS or WFPC3 observations will provide better constraints on an underlying host than available from the existing WFPC2 observations.
- 4
- 5
- 6
- 7
In the case of GRBs 050509b, 050709, 060121, and 061006, we fit additional Sérsic and point-source components to account for foreground/background objects. These components are not considered to be part of the host galaxy.
- 8
For the hosts of GRBs 060121 and 060313, with low signal-to-noise detections, the center and ellipticity were held fixed throughout the fit.
- 9
Optical afterglows have not been detected in the case of GRBs 050509b and 051210.
- 10
- 11
For the faint hosts without a known redshift (GRBs 051210, 060121, 060313, and possibly 061201), we assume z = 1 (Berger et al. 2007), and take advantage of the relative flatness of the angular diameter distance as a function of redshift beyond z ∼ 0.5.
- 12
This is significantly more precise than the large uncertainty of 0
4 quoted by D'Avanzo et al. (2009) based on absolute astrometry; for offset measurements differential astrometry provides a better approach. - 13
GRB 070714b is located at z = 0.923, while the redshift of GRB 070707 is not known. Based on the faintness of the host, R ≈ 27.3 mag, we assume z = 1 to calculate the physical offset.
- 14
GRB 070809 is located 19.6 kpc from a galaxy at z = 0.219, and about 2
3 from a much fainter galaxy, which at z ≳ 1 corresponds to 18.4 kpc. No host is detected at the position of GRB 080503 in deep HST observations, but a faint galaxy is located about 08 away, which at z ≳ 1 corresponds to 6.5 kpc. - 15
We do not consider the bursts that lack host searches since there is no a priori reason that these events (mainly from 2008 to 2009) should have a different offset distribution compared to the existing sample from 2005 to 2007.
- 16