


ABSTRACT
We have re-analyzed the NRAO VLA Sky Survey (NVSS) data to derive rotation measures (RMs) toward 37,543 polarized radio sources. The resulting catalog of RM values covers the sky area north of declination −40° with an average density of more than one RM per square degree. We present an image of the median RM over 82% of the sky with a resolution of 8° and a typical error of ±1–2 rad m−2. The image shows large-scale structures in RM that extend to very high Galactic latitudes. A simple analysis of the RM structure at high Galactic latitudes is used to derive properties of the Galactic halo magnetic field in the solar neighborhood. We find the component of the local field perpendicular to the plane (the z-component) equal to +0.30 μG for z < 0 and −0.14 μG for z>0. The reversal of sign across the Galactic plane is consistent with a quadrupole field geometry for the poloidal component of the halo field. The halo magnetic field component parallel to the disk is also found to be antisymmetric and generally consistent with a toroidal field, with strength +0.83 μG for z < 0 and −0.39 μG for z>0. We have identified five regions of the sky where the foreground median RM is consistently less than 1 rad m−2 over several degrees. These holes in the foreground RM will be useful for future studies of possible small-scale fluctuations in cosmic magnetic field structures. In addition to allowing measurement of RMs toward polarized sources, the new analysis of the NVSS data removes the effects of bandwidth depolarization for |RM| ≳ 100 rad m−2 inherent in the original NVSS source catalog. This new catalog of RMs and polarized flux densities is available online, and will be a valuable resource for further studies of the Galactic magnetic field and magnetoionic medium, and extragalactic magnetic fields.
Export citation and abstract BibTeX RIS
1. INTRODUCTION
Faraday rotation of the polarized synchrotron radiation from radio sources provides a probe of the magnetic field and thermal electron density along the line of sight. Observations of Faraday rotation measures (RMs) have been carried out since the 1960s through measurements of the wavelength dependence of polarization position angles at widely separated frequencies (e.g., Gardner & Whiteoak 1963). Compilations of published RMs were created for 555 objects by Simard-Normandin et al. (1981) and 674 objects by Broten et al. (1988). More recently, spectropolarimetric surveys of the Galactic plane (Taylor et al. 2003; Haverkorn et al. 2006) have added 528 published RM values at low Galactic latitudes (Brown et al. 2003a, 2007), while Gaensler et al. (2005) and Mao et al. (2008) have measured ∼300 RMs in the vicinity of the LMC and SMC.
The low-latitude data have been used to explore the Galactic magnetic field (Brown et al. 2003b, 2007) and the magnetoionic component of the interstellar medium (Haverkorn et al. 2008). However, the low surface density of RM at higher latitudes has precluded the use of extragalactic RMs for conclusive studies of the Galactic halo field. Xu et al. (2006) used an augmented version of the Simard-Normandin et al. (1981) catalog, containing approximately 1000 high-latitude RM values, to search for evidence of enhanced RM associated with nearby galaxy superclusters. They report tentative detections against the Hercules and Perseus-Pisces clusters, but note that "conclusions must remain tentative until we better understand the Galactic foreground."
The most extensive large-area survey of polarized radio sources to date is the National Radio Astronomy Observatory VLA Sky Survey (NVSS) which observed the sky north of declination −40° (82% of the sky) in Stokes I, Q, and U at a frequency of 1.4 GHz (Condon et al. 1998). The NVSS images and source catalog were created by combining 217,446 VLA snapshot observations in two bands, each 42 MHz wide, at 1364.9 MHz and 1435.1 MHz. Faraday rotation will produce a rotation of the polarization angle between the two bands. The effects of bandwidth depolarization on the number density of polarized sources in the NVSS catalog due to integrating over the two bands in regions of high foreground RM was reported by Stil & Taylor (2007). We have reprocessed the NVSS visibility data to create images in each of the two bands, and analyzed the data to calculate RMs for compact polarized sources. In this paper, we present the catalog of 37,543 polarized sources with RMs and polarized intensities corrected for the depolarization in the original values from the NVSS catalog. We also carry out a simple analysis on the data to derive some basic properties of the Galactic halo magnetic field.
2. THE DATA
2.1. Derivation of Rotation Measures
To derive RM values from the NVSS observations, we downloaded the calibrated NVSS visibility data sets for each snap shot from the National Radio Astronomy Observatory data server and created mosaic images in Stokes I, Q, and U in each of the two bands. The images were created using AIPS. A mosaic weight image was also created to provide an estimate of the theoretical noise as a function of position. We also created images with combined data from both bands to measure the amount of depolarization. Since we use the peak intensity as an estimate of the source flux, a mild u–v taper was applied, degrading the resolution slightly compared to the original NVSS images to mitigate resolution effects. The peak flux density was measured in each image at the position of every NVSS catalog source with cataloged Stokes I intensity greater than 5 mJy. The noise level, σ, for the Q and U values was determined by calculating the rms variation about the mean in an annulus around each source in the mosaic images. The peak intensity was taken to be the map peak minus the local off-source mean. A source was retained for measurement of the RM if the signal-to-noise ratio for polarized intensity  was greater than 8σ. At this signal-to-noise level the noise bias correction to p is negligible (Simmons & Stewart 1985). We also required that the percent polarization is greater than 0.5% to ensure that the polarized intensity is not dominated by instrumental effects (Condon et al. 1998).
This process resulted in 37,543 sources for which RMs were derived from the change in polarization position angle between the two bands. From the change in position angle Δτ, the observed RMo was calculated as
where λ1 and λ2 are the center wavelengths of the bands at 1435 MHz and 1365 MHz, respectively, and C is a correction factor that accounts for the effect of the finite width of the bands on the effective center wavelength in λ2 space, given by
for the NVSS.
Given that we have only two data points in λ2, there is a potential ambiguity between the true RM of the sources and the observed RMo due to the possibility of wrapping of the polarization position angle between the two bands. The true RM can take on any value given by
where m is an integer representing the number of wraps which occurred between λ2 and λ1. A single wrap (m = ±1), which can occur even for small RM, produces an increment in the observed RM of ±652.9 rad m−2. A double wrap (m = ±2) would require |RM|>1306 rad m−2. RMs of this magnitude are rare, and typically encountered only near the Galactic plane and toward the inner galaxy (Brown et al. 2007). In our analysis we assume |m| ⩽ 1.
We used the amount of depolarization to help resolve the RM ambiguity. Figure 1 shows the depolarization (ratio of observed to true polarized flux density) as a function of true RM for polarized flux densities measured in the individual bands and integrated over both bands. The polarized flux measured from images created by merging u–v data from both bands (pi) suffers considerable depolarization for RM greater than about 100 rad m−2. This will be the case for the NVSS catalog flux. Polarized flux densities measured in the individual bands (p1 and p2) are a good representation of the true flux density up to RM of 400 rad m−2. Moreover, the ratio of polarized flux density in the individual bands to the band-integrated flux density, Ro = (p1 + p2)/2pi, is a function of |RM|. For each polarized source, the predicted value of R(m) for each of the three possible values or RM (m = −1, 0, +1) was compared to the measured R. A likelihood was assigned to each value of RM based on the error on Ro and the difference between the measured and predicted value of R for each m. The RM value with the highest likelihood was selected as the true RM.
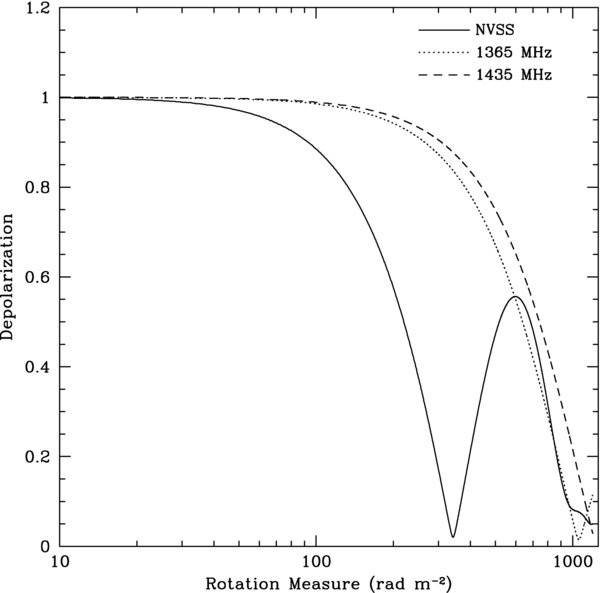
Figure 1. Depolarization due to bandwidth as a function of the magnitude of rotation measure. The solid line shows the depolarization in the original NVSS images due to combination of visibility data from the two bands. The dashed and dotted lines show the bandwidth depolarization from each individual band at 1435 MHz and 1365 MHz, respectively. The NVSS suffers considerable bandwidth depolarization for |RM|>100 rad m−2 (Condon et al. 1998).
Download figure:
Standard image High-resolution imageThere are two situations in which this analysis breaks down. First, the curves in Figure 1 show that for both |RM| < 50 and |RM|>520 the Ro ∼ 1.0. In the presence of errors on Ro our algorithm is thus unable to distinguish between these two cases. Second, the value Ro is insensitive to the sign of the RM, thus RM ± 326.5 which differ by m = ±1 and produce equal amounts (almost total) depolarization cannot be distinguished. To resolve these final ambiguities, we used the spatial distribution of RM values on the sky. For each source, we derived the median value of RM for all other sources within a radius of 3°. If the RM value of the source differed from the median value in the surrounding area by more than 520, the RM value was corrected by adding or subtracting 652.9. As a consequence, there are no RM values in the catalog that are more than 520 rad m−2 from the median of the surrounding values. Any such objects have had their RM amplitude adjusted downward by 652.9. This should not in general be an issue for sources more than a few degrees from the Galactic plane.
Figure 2 shows our NVSS-derived RMs plotted against previously determined RMs for sources with |b|>10°. The comparison list was compiled by J. Brown using RM data published between 1988 and 2001 (Broten et al. 1988; Clegg et al. 1992; Oren and Wolf 1995; Minter and Spangler 1996; Gaensler et al. 2001). While a few outliers are seen, there is very good agreement for the majority of the sources. Differences between our results and previous observations could result from unwrapping errors in the older data which are typically taken at widely spaced frequencies, the effects of different angular resolution for slightly resolved sources, nonlinear behavior of RM with λ2, or, possibly, changes in RM due to intrinsic variability in polarized properties of the radio source.
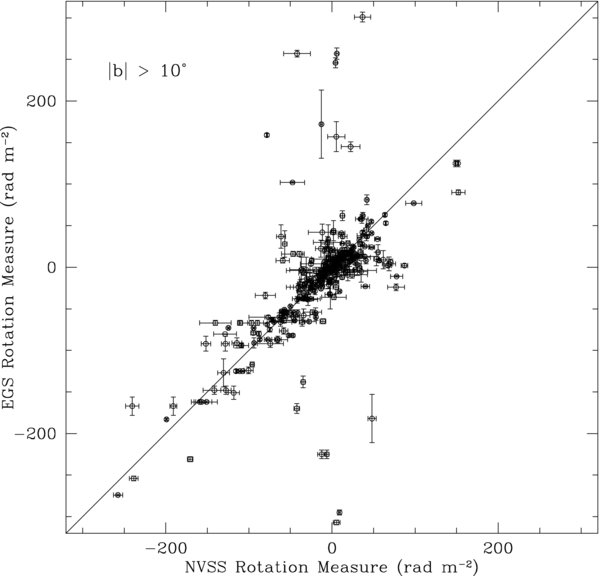
Figure 2. Comparison of our NVSS-derived RMs with previously published rotation measures for extragalactic sources with |b|>10°.
Download figure:
Standard image High-resolution image2.2. The Catalog
Table 1 lists the data for the first 10 sources of the RM catalog. Columns 1–4 list the right ascension and declination (J2000) and galactic coordinates of the source. Column 5 is the integrated Stokes I flux density from the NVSS catalog. Column 6 is the average peak polarized intensity (p1 + p2)/2, and Column 7 the percent polarization (ratio of peak polarized intensity to peak Stokes I). Finally, Column 8 lists the derived RM for the source with error. All errors in the table are 1σ. The full catalog is available online at http://www.ucalgary.ca/ras/rmcatalogue.
Table 1. NVSS Rotation Measure Catalog (first ten entries)
| R.A. (J2000) | Decl. (J2000) | l (°) | b (°) | SI (mJy) | p (mJy) | m (%) | RM (rad m−2) |
|---|---|---|---|---|---|---|---|
| 00 00 02.87 ± 0.03 | +09 57 06.60 ± 0.6 | 102.6200 | −50.8820 | 301.4 ± 10.6 | 10.72 ± 0.28 | 3.85 ± 0.10 | −7.7 ± 4.9 |
| 00 00 08.22 ± 0.12 | +75 40 11.90 ± 0.6 | 119.6979 | 13.1213 | 139.3 ± 4.2 | 6.97 ± 0.28 | 5.08 ± 0.20 | 15.4 ± 9.0 |
| 00 00 09.21 ± 0.04 | +25 26 20.10 ± 0.6 | 108.5905 | −36.0006 | 59.5 ± 2.2 | 4.02 ± 0.27 | 7.82 ± 0.53 | −59.0 ± 14.7 |
| 00 00 10.10 ± 0.04 | +30 55 59.50 ± 0.6 | 110.1511 | −30.6630 | 88.2 ± 2.7 | 5.55 ± 0.29 | 6.51 ± 0.34 | −37.9 ± 11.0 |
| 00 00 12.20 ± 0.04 | +29 11 14.40 ± 0.6 | 109.6856 | −32.3632 | 83.4 ± 2.9 | 3.70 ± 0.27 | 5.25 ± 0.38 | −87.0 ± 15.1 |
| 00 00 12.35 ± 0.05 | +07 12 47.00 ± 0.8 | 101.2392 | −53.4871 | 29.0 ± 1.2 | 3.20 ± 0.27 | 12.12 ± 1.02 | −28.3 ± 18.1 |
| 00 00 17.06 ± 0.05 | −34 10 28.90 ± 0.7 | −2.8588 | −76.9522 | 124.6 ± 4.5 | 6.53 ± 0.27 | 7.90 ± 0.33 | −5.0 ± 9.2 |
| 00 00 19.87 ± 0.12 | +55 39 59.00 ± 1.1 | 115.7202 | −6.4882 | 15.4 ± 0.6 | 4.57 ± 0.34 | 2.03 ± 0.15 | −47.8 ± 18.3 |
| 00 00 20.45 ± 0.05 | +55 39 08.60 ± 0.6 | 115.7188 | −6.5021 | 1517.8 ± 52.9 | 17.18 ± 0.38 | 1.29 ± 0.03 | −51.8 ± 4.6 |
| 00 00 23.96 ± 0.04 | +12 29 50.70 ± 0.7 | 103.9472 | −48.4840 | 111.3 ± 3.7 | 4.35 ± 0.28 | 6.44 ± 0.41 | −23.9 ± 14.2 |
Download table as: ASCIITypeset image
The sky distribution of the catalog RMs in Galactic coordinates is shown in Figure 3. The value of RM for each of the 37,543 sources is represented by a circle plotted at its Galactic coordinates. The size of the circle scales linearly with the amplitude of RM. The black circle at l, b = −60°, − 30° is a reference circle for |RM| = 300 rad m−2. Positive RMs are shown as red circles and negative RMs as blue.

Figure 3. Plot of 37,543 RM values over the sky north of δ = −40°. Red circles are positive rotation measure and blue circles are negative. The size of the circle scales linearly with magnitude of rotation measure.
Download figure:
Standard image High-resolution image3. ANALYSIS
3.1. Sky Distribution of RM
The plot of individual RM values in Figure 3 shows large-scale coherent structures and high values of RM extending to several tens of degrees from the Galactic plane. Fainter structures can be seen all the way to the polar regions. To obtain a quantitative picture of the sky structure of RM on scales of several degrees, we created an image of the median RM as a function of l, b. The sky was gridded on 0 5 pixels with the value at each pixel set to the median RM of all sources within a radius of 4° of the pixel location. The resulting median RM image is shown in Figure 4. Typically, 60–80 sources were used to derive each median value. The characteristic 1σ error on the median value is thus around 2 rad m−2.
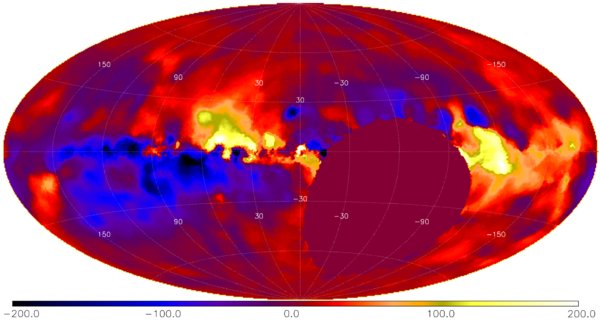
Figure 4. Image of the median value of rotation measure. Each pixel represents the median rotation measure of all sources within a circle of diameter of 8°. Typically about 60 sources contribute to each median calculation.
Download figure:
Standard image High-resolution imageThe average value of the median RM over the region δ> − 40° is 16.7 rad m−2. There is limited solid angle with very low RM on scales of several degrees. We have identified only five regions larger than 5° across where the amplitude of the median RM is consistently below 1 rad m−2. These "holes" in the foreground RM structure of the Galaxy, listed in Table 2, may be useful for studies of the small-scale structure of cosmological magnetic fields (see, for example, Kolatt 1998).
Table 2. Regions of Low Rotation Measure
| Region | R.A. (J2000) | Decl. (J2000) | l (°) | b (°) | Radius (°) |
|---|---|---|---|---|---|
| 1 | 14 17 33 | +42 51 04 | 80.5 | +66.5 | 10.0 |
| 2 | 23 37 58 | −14 55 28 | 64.5 | −69.0 | 9.1 |
| 3 | 14 23 55 | +01 59 45 | −12.2 | 56.5 | 8.8 |
| 4 | 13 20 30 | +40 52 53 | 101.2 | 74.5 | 5.7 |
| 5 | 01 36 05 | +08 46 35 | 141.2 | −52.5 | 5.1 |
Download table as: ASCIITypeset image
3.2. Implications for the Galactic Halo Magnetic Field
Many of the RM structures in Figure 4 on scales of tens of degrees are due to the local Galactic interstellar medium. A more detailed analysis of these and other features in the all-sky RM data will be presented in a later paper. However, variations on the very largest scales can be attributed to the structure of the global Galactic magnetic field. Here we point out some initial implications for the Galactic magnetic field. The value of RM is the integral of the line-of-sight component of the magnetic field weighted by the line-of-sight distribution of electron density, given by
where B has units of μG, ne has cm−3, and dl has pc. The all-sky RM images show large-scale RM structures centered around the Galactic plane extending to several tens of degrees from the plane. Using pulsar data and Hα emission, Gaensler et al. (2008) derive a scale height of he = 1.83+0.12−0.25 kpc for the free electron distribution. For this scale height, at b = 30° half of the total Galactic electron column along the line of sight is encountered within a distance whose projection onto the disk of the Galaxy is 2.2 kpc. For b = 40°, this decreases to 1.5 kpc. Large-scale RM structures at intermediate to high latitudes will thus be dominated by the geometry of the Galactic halo magnetic field within a cylinder that extends only a few kpc from the solar neighborhood.
We consider the effect of a simple magnetic field geometry within this cylinder given by

defined on a Cartesian coordinate frame with the  -axis pointing away from the Galactic center and the
  -axis toward the north Galactic pole. Bxy is the amplitude of the field parallel to the plane of the Galaxy, assumed in this simple model to be independent of height, z. The angle ϕo is the inclination of Bxy to the solar circle, defined as zero in the direction of l = 90°. Bz is the poloidal component of the field perpendicular to the disk. With this model, and an electron distribution given by
  , the RM as a function of galactic coordinates will be
RM is defined positive for the magnetic field directed toward the observer.
Figure 5 shows the mean and rms value of the distribution of RMs over all longitudes covered by the data as a function of Galactic latitude. Integrating Equation (6) over all values of l removes the contribution of the disk field from RM(l, b), yielding

For b < −73° and b>19°, the data provide complete longitude coverage (see Figure 3). Over these ranges, Figure 5 shows an approximately constant value of average RM. It is striking that the average RM is positive in both the northern and southern hemispheres. The average RM of the 756 sources within 15° of the southern Galactic pole is 6.2 ± 0.68 rad m−2. The corresponding value for the 1025 sources within 15° of the northern Galactic pole is 3.0 ± 0.52 rad m−2. Adopting the Gaensler et al. (2008) values of no = 0.014 cm−3 and he = 1830 pc, the implied z-component magnetic fields in the solar neighborhood are Bz = +0.30 ± 0.03 μG for z < 0 and Bz = −0.14 ± 0.02 μG for z>0. The vertical component of the field changes sign across the plane. This is not consistent with a simple dipolar explanation for the vertical field (Han 2009), requiring instead a higher order multipole field.

Figure 5. Mean (data points and dotted line) and standard deviation (dashed line) of the distribution or rotation measures as a function of Galactic latitude. Each point represents the values for a 5° bin in Galactic latitude. The error bars on the mean values are formal 1σ errors on the mean. The number of RM values in each latitude range varies from several hundred at the highest latitudes to over 1000 at intermediate latitudes. The vertical lines delimit the range of latitude where longitude coverage is incomplete due to the lower declination limit of the NVSS. Complete coverage in Galactic longitude is achieved for b < −73° and b>19°. Over this range, the mean RM remains closely constant as expected for an antisymmetric poloidal field (see the text). The negative dip from b = −50° to 0° is largely due to missing data at negative longitudes over this latitude range.
Download figure:
Standard image High-resolution imageAn estimate of the component of the halo field parallel to the plane was derived by fitting Equation (6) to the variation of the median RM(l) as a function of b. Figure 6 shows sample fits to data at b = 45° and b = −45°. The data show clear 360° period oscillations that are well represented by simple sinusoids, as predicted by Equation (6). The amplitude and phase of the family of sine fits as a function of latitude are shown in Figure 7. As can be seen in both Figures 6 and 7, the direction of Bxy reverses by 180° across the Galactic plane. The curves in the lower panel of Figure 7 are the coefficient of sin(l − ϕo) in Equation (6),
with no and he from Gaensler et al. (2008) and Bxy = +0.83 μG below the plane (z < 0, dashed line) and Bxy = −0.39 μG above the plane (z>0, dot-dashed line). As for the Bz component, the fits imply that the field parallel to the plane changes sign across the plane and the magnitude below the plane is approximately twice as large as that above. The average value of ϕo (the upper panel of Figure 7) is 11° ± 30°. This result is generally consistent with an antisymmetric circular toroidal halo field component that reverses sign above and below the plane, as suggested by Han (2009). There is an indication in Figure 7 that ϕo increases at high positive latitudes, suggesting a more complex halo field configuration at higher z.

Figure 6. Sinusoidal fits to median RM as a function of longitude for b = 45° (lower panel) and b = −45° (upper panel). The longitudes with no data in the upper panel are below the declination limit of the NVSS.
Download figure:
Standard image High-resolution image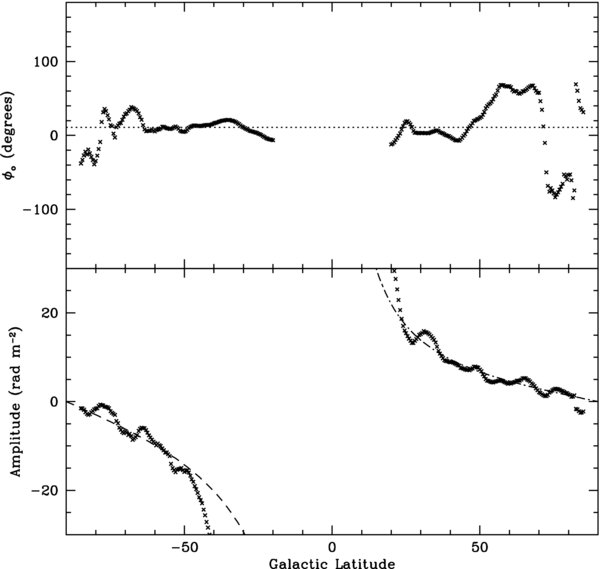
Figure 7. Latitude dependence of the fitted model parameter of Equation (6) to the longitude variation of RM. The data points show for each Galactic latitude the amplitude (bottom) and phase (top) of the sinusoidal fit to the variation of the median rotation measure with longitude (see Figure 4 for b = ±45). The dashed line in the bottom panel is the predicted latitude dependence of the amplitude of the sinusoid (Equation (8)) with Bxy = 0.89 μG for negative latitudes and Bxy = −0.39 μG for positive latitudes. The dotted line at top shows the average value of ϕo = 11°.
Download figure:
Standard image High-resolution image
4. CONCLUSIONS
By re-analysis of the NVSS visibility data, we have derived RM values for 37,543 lines of sight to polarized radio sources. The resulting catalog of RMs, covering the 82% of the sky north of δ = −40°, has an average density on the sky of more than one RM per square degree—almost 2 orders of magnitude more densely sampled than previously published catalogs of RM outside of the Galactic plane.
An image of the median RM over the survey region reveals a highly structured RM sky. Large-scale RM features with amplitudes of order 100 rad m−2 extend tens of degrees from the Galactic plane. Structures with amplitudes ∼10 rad m−2 persist to high latitudes. We identify only five regions where the measured median RM is consistently less than 1 rad m−2 over an angular diameter greater than 5°.
The positive RM at both Galactic poles indicated that the poloidal magnetic field in the halo of the Galaxy reverses sign across the Galactic plane, and we measure the amplitude of the field to be a few hundred nG. On the largest scales, the median RM exhibits a sinusoidal variation with longitude that is antisymmetric about the Galactic plane. These variations are well fitted by an antisymmetric halo field component parallel to the Galactic plane with values of −0.39 μG at z>0 and 0.83 μG at z < 0, roughly consistent with a circular toroidal magnetic field that changes direction across the plane.
The full RM catalog is available online at www.ucalgary.ca/ras/rmcatalogue. These data will be useful for a range of studies, including further investigations of the global Galactic magnetic field and the properties of the Galactic magnetoionic medium, searches for evidence of magnetic fields associated with clusters and the large-scale structure of the universe, and investigations of the polarization properties of active galactic nucleus (AGN) and radio galaxies.
This work was supported by a grant to A.R.T. from the Natural Sciences and Engineering Research Council of Canada. The National Radio Astronomy Observatory is a facility of the National Science Foundation operated under cooperative agreement by Associated Universities, Inc.