ABSTRACT
We have determined the isotopic abundance ratio of 7Li/6Li in the interstellar media (ISMs) along lines of sight to HD169454 and HD250290 using the High-Dispersion Spectrograph on the Subaru Telescope. We also observed ζ Oph for comparison with previous data. The observed abundance ratios were 7Li/6Li = 8.1+3.6−1.8 and 6.3+3.0−1.7 for HD169454 and HD250290, respectively. These values are in reasonable agreement with those observed previously in the solar neighborhood ISMs within ±2σ error bars and are also consistent with our measurement of 7Li/6Li = 7.1+2.9−1.6 for a cloud along the line of sight to ζ Oph. This is good evidence for homogeneous mixing and instantaneous recycling of the gas component in the Galactic disk. We also discuss several source compositions of 7Li, Galactic cosmic-ray interactions, stellar nucleosynthesis, and big bang nucleosynthesis.
Export citation and abstract BibTeX RIS
1. INTRODUCTION
The elemental abundance of lithium preserves rich information from the early big bang universe to the present Milky Way. Lithium has two stable isotopes, 6Li and 7Li. Within the framework of a well-established theory of standard big bang nucleosynthesis (BBN; Wagoner 1973; Yang et al. 1984; Copi et al. 1995), significant amounts of the light elements, 2H (D), 3He, 4He, and 7Li, were synthesized during the first 3 minutes of the hot big bang universe. At later times, 7Li is continuously produced by stellar nucleosynthesis (Travaglio et al. 2001), as well as by spallation and α + α fusion reactions of Galactic cosmic-rays (GCRs) interacting with the interstellar medium (ISM), while 6Li is almost purely synthesized by the GCR–ISM interactions (Meneguzzi et al. 1971; Prantzos et al. 1993; Ramaty et al. 1997). Both 6Li and 7Li have a destruction sink of stellar processing once they are embedded in the stellar envelope and interior where they are easily burnt at T ∼ 106 K. This fragile nature of lithium in turn provides a critical test in identifying brown dwarfs (Rebolo et al. 1996) and planet harboring stars (Israelian et al. 2001). Detection of lithium in primeval gas from the big bang and in various stellar objects provides important keys to understanding not only the origin of atomic nuclides but the chemical evolution of stars and galaxies.
Since primordial abundances of the light elements are quite sensitive to the cosmological parameter Ωb ≡ ρb/ρC, where ρb is the universal baryon density and ρC is the critical density to marginally close to the universe, a number of observations have been devoted to determine these primordial abundances. The current importance of BBN has been highlighted by the recent independent estimate of Ωb along with many other cosmological parameters from the Wilkinson Microwave Anisotropy Probe (WMAP) data of cosmic microwave background (CMB) anisotropies (Spergel et al. 2003, 2007). There still remains serious debate concerning the extent of systematic errors in the observed primordial abundance of D/H from several Ly–α clouds along the line of sight to high-redshift quasi-stellar objects (QSOs; Kirkman et al. 2003; Hogan 1996) and on the 4He abundances from extragalactic H ii regions in low-metallicity irregular galaxies (Izotov et al. 2007). Thus, precise determination of the primordial abundance of the third element 7Li (Austin & King 1977) is urgently sought in order to constrain the controversies.
7Li, however, has a disadvantage because of its considerably smaller primordial abundance than D and 4He. Another disadvantage has been the fact that determination of the primordial 7Li abundance has been limited to observations of the photospheres of nearby metal-deficient dwarf stars whose Li abundances are subject to uncertainties due to poorly understood processes of convective mixing (Pinsonneault et al. 1999) that can result in overionization and also nuclear destruction of Li in stellar envelopes. Such stellar depletion effects cast serious doubt on whether the observed Spite plateau (Spite & Spite 1982) really reflects the primordial 7Li abundance. Korn et al. (2007) made a noticeable progress on the stellar depletion of Li, however, this problem is under discussion.
The importance of the interstellar isotopic ratio of lithium was firstly discussed by Reeves (1993) and Steigman (1993). An independent method for the primordial 7Li was proposed (Kajino et al. 2000; Kawanomoto 2002) to make use of the isotopic abundance ratio 7Li/6Li in the ISM. This method has several advantages: first and foremost, both 7Li and 6Li in the ISM are totally free from stellar depletion effects and therefore the 7Li/6Li ratio is not affected by the destruction sink of stellar processing. Second, since both isotopes 7Li and 6Li have the same chemical properties, any effects due to overionization and dust condensation are canceled in their ratio. Thus, although quite uncertain ionization and depletion corrections are required to measure the atomic abundance of Li in the ISM, the measurement of the isotopic ratio eliminates these uncertainties.
The 7Li/6Li ratio presumably depends on the Galactic chemical evolution (GCE) which affects each isotope in a different manner. This complication should be untangled when one decomposes the observed ISM–7Li/6Li ratio into the primordial abundance component and the other production components. The 6Li in the present-day gas clouds is shown to be synthesized almost entirely by GCR interactions with the ISMs (Meneguzzi et al. 1971; Prantzos et al. 1993; Ramaty et al. 1997). However, 7Li has at least three different stellar production sites in addition to the GCR–ISM interactions. These are ν-induced nucleosynthesis in He- and C-layers of Type II supernova (SN) explosion (ν-process; Woosley et al. 1990; Woosley & Weaver 1995; Yoshida et al. 2006a, 2006b), nova nucleosynthesis (José et al. 2003) and nucleosynthesis in asymptotic giant branch (AGB) stars (Forestini & Charbonnel 1997). These production sources have different intensities and efficiencies which depend on the star-formation rate and on the stellar-mass versus gas-mass fraction as a function of Galactocentric distance, RG.
In stellar atmospheres, the intrinsic width of absorption lines is generally broader than the isotopic shift of lithium and therefore the absorption lines of Li i isotopes cannot be easily separated from each other, for example, typical full width at half-maximum (FWHM) of absorption lines in population II stars is about 5 km s−1 (Asplund et al. 2006). In the cold gas clouds of the ISM, on the other hand, intrinsic line widths are so small that one can separate the 6Li-absorption line more easily from the 7Li line. However, the 6Li lines are not completely separate from those of 7Li; the strong 6Li i line is blended with the weak fine structure component for 7Li i, as indicated in the figure of Knauth et al. (2000). In addition to this, there is another difficulty. If the column density of the ISM is too small in the foreground of the bright star, one cannot detect very weak Li i absorption lines. If the column density is moderately high and the background star is not very bright, then one also cannot detect too weak Li i absorption lines. We have to choose a proper combination of the ISM and suitably bright background stars. For these reason, although detection of lithium in the ISM was first tried in the early 1970s (Traub & Carleton 1973), the first successful detection of the Li isotopic ratio was not until the late 1970s (Vanden Bout et al. 1978). The quality of their data, however, did not allow a good error estimate in the analysis of the lithium isotopic ratio.
Observational efforts for the measurement of lithium isotopes in the ISMs commenced in the 1980s and until now have concentrated on the solar neighborhood. The first successful measurement of the Li isotopic ratio with realistic error estimation was carried out by Ferlet & Dennefeld (1984). They observed δ Sco and ζ Oph and reported the 7Li/6Li ratio only for ζ Oph. Their value however was extremely high in comparison with the solar system meteoritic value. Since 1990s, charge-coupled devices (CCDs) have been used in these critical observations for Li isotopes. Lemoine et al. (1993) reported the Li isotopic ratio for ρ Oph the same as the meteoritic ratio. ζ Oph and ζ Per were observed by Meyer et al. (1993) but the Li isotopic ratio for ζ Oph was not consistent with the value of Ferlet & Dennefeld (1984). ζ Oph was observed again by Lemoine et al. (1995) with an extremely high signal-to-noise ratio (S/N) and high spectral resolving power. They reported relatively low isotopic ratio for this cloud. Li isotopic ratios for o Per and ζ Per were reported by Knauth et al. (2000) and o Per was re-observed by Knauth et al. (2003) together with the other four stars. Howarth et al. (2002) reported the Li isotopic ratio for ζ Oph comparable to the meteoritic ratio. All these observations were for the nearby ISMs along lines of sight to background stars which were located within ⩽0.45 kpc from the Sun.
Recent advances in observational technique made by using high-dispersion spectrographs on the world's largest telescopes such as Subaru, Keck, and Very Large Telescope (VLT) have enabled us to detect lithium isotopes even in metal-deficient population II stars (e.g., Asplund et al. 2006). We have recently carried out spectroscopic observations of three gas clouds along the line of sight to HD169454, HD250290, and ζ Oph using the High-Dispersion Spectrograph (HDS; Noguchi et al. 2002) on the Subaru Telescope. Although ζ Oph is a very bright, early-type star in the solar neighborhood, the other two stars HD169454 and HD250290 are potentially distant objects located 1.7 kpc and 2.2 kpc from the Sun. It is possible that intervening absorber is situated far from the solar system.
The first purpose of this article is to report our result for the observed 7Li/6Li isotopic abundance ratio of these three ISMs. The second purpose is to try to find an interesting proposition that the lithium isotopic ratio could exhibit an RG dependence over a wide range. If a slope of the 7Li/6Li ratio is shown from our extensive observation, we might be able to discuss decomposition of the observed 7Li/6Li ratio into three different production sources of 7Li, namely, GCR spallation and α + α fusion, stellar nucleosynthesis and BBN. If RG dependence of 7Li/6Li ratio cannot be established, we can use averaged value of the ratio to decompose it. Although Knauth et al. (2003) first decomposed the sources for 7Li, we adopt different approach from theirs in the light of the importance of primordial 7Li problem. We here denote the stellar nucleosynthesis component as the sum of a further three contributions from Type II SNe (ν-process), nova nucleosynthesis, and nucleosynthesis in AGB stars. This paper is organized as follows: in Section 2, we discuss the observational setup and data reduction; details of data analysis are discussed in Section 3. In Section 4, we discuss the observed results of the ISM–7Li/6Li isotopic abundance ratio and compare them with the previous data. Detailed discussions of the decomposition into three different production sources will also be made in this section. We present the conclusions in Section 5.
2. OBSERVATION AND DATA REDUCTION
2.1. Sample Selection
As discussed below, the distances of background continuum sources are key issues for the secondary purpose of this study. The HIPPARCOS catalog (Perryman et al. 1997) provides the most reliable parallax measurements for nearby objects (<1 kpc), however, as we wished to identify more distant candidates for background continuum sources we needed to use distance indicators other than parallax. We selected our candidates from the brightest stars in the galaxy tabulated by Humphreys (1978) although spectroscopic distance estimates involve several uncertainties to be discussed below.
2.2. Distances of Background Continuum Sources
The lithium 7Li/6Li ratios reported in the previous observations are summarized in Table 5. It is notable that the background stars are all within 0.5 kpc of the Sun. We observed one of these nearby stars ζ Oph as a reference because it was most frequently studied by several groups and because it satisfied the necessary criteria for successfully observing the Li i absorption lines in the ISM being bright and having a featureless spectrum and a fair color excess. In our present work, we chose from Humphreys (1978) two further stars HD169454 and HD250290 as background continuum sources that also satisfied the above criteria.
In this section, we discuss how to estimate the distances of these stars together with other useful properties and observational information to be summarized in Tables 1 and 2.
Table 1. Observed Data for Background Stars
| Star | Spectral Typea | Va (mag) | B − Va (mag) | la (deg) | ba (deg) | E(B − V)b (mag) | Group | d (kpc) | RG (kpc) |
|---|---|---|---|---|---|---|---|---|---|
| ζ Oph | O9V | 2.58 | +0.02 | 6.3 | +23.6 | +0.30 | Sco OB2 | 0.146c | 8.36 |
| HD169454 | O+ | 6.65 | +0.74 | 17.5 | -0.7 | +1.02 | Sct OB3 | 1.7d | 6.8 |
| HD250290 | B3Ib | 7.41 | +0.49 | 186.6 | +0.1 | +0.62 | NGC2129 | 2.2, 0.44e | 10.7 |
Notes. aSIMBAD Database, operated at CDS, Strasbourg, France. bPapaj et al. (1993). cMaíz-Apellániz et al. (2004). dThe distance is derived from Humphreys (1978), Mel'nik & Efremov (1994), Kemp et al. (2002), and Thorburn et al. (2003) ranging from 0.93 kpc to 3 kpc. We adopt 1.7 kpc which is close to the central value. eThe distance 2.2 kpc is reported by Carraro et al. (2006). According to the HIPPARCOS catalog (Perryman et al. 1997), it is 0.439+0.446−0.147 kpc.
Download table as: ASCIITypeset image
Table 2. Subaru/HDS Li i and K i Observations
| Star | Region | Date | Resolving Power | Number of Exposures | Total Exposure Time (s) | S/N (pixel−1) |
|---|---|---|---|---|---|---|
| ζ Oph | Li i | 2005 May 17–18 | 95000 | 20 | 240 | 1800 |
| HD169454 | Li i | 2000 Jul 1–2 | 95000 | 21 | 4500 | 1800 |
| K i | 2000 Aug 20, 2001 Apr 13 | 95000 | 10 | 5340 | 900 | |
| HD250290 | Li i | 2000 Nov 11 | 95000 | 11 | 6300 | 1500 |
| K i | 2001 Jan 28 | 95000 | 10 | 12000 | 800 |
Download table as: ASCIITypeset image
2.2.1. ζ Oph
Because of its brightness, fast rotation, and fair extinction, ζ Oph has been well observed for investigating interstellar absorption lines including Li i lines. We selected this star as a reference of Li i absorption in order to evaluate the quality of spectra obtained with the Subaru HDS. ζ Oph is a member of the OB association Sco OB2 whose distance is 0.140+0.016−0.013 kpc based on its HIPPARCOS parallax of 7.12 ± 0.71 mas. According to Maíz-Apellániz et al. (2004), the heliocentric distance of ζ Oph is 0.146+0.017−0.014 kpc which is consistent with the HIPPARCOS catalog.
The V magnitude is 2.58 mag and the spectral type is O9V. The Galactic coordinate of this star is (l, b) = (6.3, +23.6). The observations were carried out on 2005 May with the Subaru HDS.
2.2.2. HD169454
HD169454 is a member of the OB association Sct OB3. The HIPPARCOS parallax of HD169454 is 0.00 ± 1.14 mas providing no definite distance. The heliocentric distance of the Sct OB3 association is reported to be 1.66 ± 0.10 kpc (Humphreys 1978) and 1.48 ± 0.18 kpc (Mel'nik & Efremov 1994). Federman & Lambert (1992) estimated the distance of this star as 2–3 kpc from observations of high-velocity interstellar gas toward HD169454. The spectroscopic parallax of the star reported by Kemp et al. (2002) and Thorburn et al. (2003), indicate distances of ∼3 kpc and 0.93 ± 0.23 kpc, respectively. We adopt 1.7 kpc, close to the central value of these reported distances for HD169454.
Both molecular and atomic clouds are likely to exist between HD169454 and the Sun. Along the line of sight toward HD169454, a molecular cloud is observed at a distance of 0.125 or 0.7 kpc from radio observation (Jannuzi et al. 1988). According to Crutcher & Lien (1984), the atomic clouds which have radial velocities VLSR = +4 km s−1 and +7 km s−1 are also located at a distance of around 0.125 kpc. They deduced this from optical observations of the Na i D-line absorption toward 49 stars located over 345° < l < 385° and −7° < b < +7°. Survey observation of interstellar K i line components (Rickard 1974) showed that an ISM gas cloud lies between 1 and 1.7 kpc in the foreground of HD169454. In our observations, molecular absorption lines of CN and CH were detected.
We carried out observations on 2000 July, 2000 August, and 2001 April with the Subaru HDS. The V magnitude is 6.65 mag and the spectral type is O+. The Galactic coordinate of this star is (l, b)=(17.5, −0.7) and it lies in the direction of the Galactic center.
2.2.3. HD250290
HD250290 is considered to be a member of the open cluster NGC2129. The HIPPARCOS parallax of this star is 2.28 ± 1.15 mas and as the relative error of parallax Δπ/π ∼ 0.5 is not small, the estimated distance is rather uncertain 0.439+0.446−0.147 kpc. However, Humphreys (1978) reported a heliocentric distance of 1.82 ± 0.27 kpc, where we estimate the error bars ±15% taking account of uncertainties in the distance modulus. Carraro et al. (2006) derived an improved determination of the distance of the open cluster of 2.2 ± 0.2 kpc. Although the distance reported by Carraro et al. (2006), seems more reliable due to its small error bars, we leave the definitive determination of its distance for future observations.
As for the gas cloud toward HD250290, there is no observational evidence as to the distance of the absorber. It is difficult to determine its location because the observed radial velocity of the atomic lines is close to zero. Note that a molecular cloud is reported by Kim et al. (2000) to be at a distance of 1.1 ± 0.1 kpc in the Galactic anticenter direction of (l, b) = (178 0–186
0–186 0, 3
0, 3 5–6
5–6 0). However, this direction is 5° north from HD250290.
We carried out observations on 2000 November and 2001 January with the Subaru HDS. The star has a V magnitude of 7.41 mag and its spectral type is B3Ib. The Galactic coordinate is (l, b) = (186.6, +0.1) and it lies in the Galactic anticenter direction.
2.3. Distances of Absorbing Clouds
Although the background sources may be located far from the solar system, there are not definite evidences which indicate large distance of absorbing clouds. Furthermore, the fact that observed radial velocities of the clouds are near zero in the local standard of rest (LSR) indicates these gas clouds are likely to be near the Sun. So we adopted zero as the distance of the absorbing clouds toward HD169454 and HD250290.
2.4. High-resolution Spectroscopy
In order to resolve the weak 7Li i doublet lines at 6707.76 Å and 6707.91 Å with isotopic shifts of 0.16 Å for the 6Li i, the relative spectral resolution should be at least (6708/0.16) × 2 ∼ 84000. Since the expected strength of the interstellar Li absorption is a few milliangstroms, the required S/N to detect small fraction of 6Li is higher than 1000 pixel−1 element. In order to resolve the velocity structure of the absorber, according to the method presented by Knauth et al. (2000), we chose the weak K i lines at 4044 Å and 4047 Å for reference. These lines have similar strength to the Li lines, so they are suitable to resolve the velocity components.
All observations were taken with the HDS on the optical-Nasmyth platform of the 8.2 m Subaru Telescope of National Astronomical Observatory of Japan at the summit of Mauna Kea. The observational data were collected in two spectral regions: one a blue region including K i 4045 Å for resolving the velocity structure of the absorbing cloud, the other a red region including the Li i 6708 Å for investigating the isotopic ratio of Li. The blue and red setting covered 3400–5200 Å and 5100–7800 Å, respectively. For ζ Oph, only a red spectrum was obtained. We adopted the velocity component estimated by previous work (Ferlet & Dennefeld 1984; Meyer et al. 1993; Lemoine et al. 1995; Howarth et al. 2002). The slit width was set to 0.180 mm (0.36 arcsec on the sky) and the spectral resolution measured using the Th–Ar emission line width was 95,000 at 6700 Å. For the red setting, an SC-46 order cut filter was placed after the entrance slit in order to block the second-order light of the cross disperser. For the blue setting, a quartz plate was inserted after the slit so as not to shift the focal position of the spectrograph. Our objects were sufficiently bright on the Subaru Telescope that all exposures were limited to 10 minutes at most to avoid saturation. We took tens of exposures for each object to attain the required S/N.
2.5. Data Reduction
Spectral images directly obtained with the CCD were reduced in a standard way using the Image Reduction and Analysis Facility (IRAF)11 version 2.11.3. Ten bias images were taken each night to remove any instrumental effects due to the CCD electronics. Wavelength calibration spectra of Th–Ar lamp were taken every 2 hr during observations. The average value of the overscan region in each image was subtracted from the respective images. The median image of bias images was subtracted from all stellar, Th–Ar and flat images. The scattered light was fitted by a two-dimensional low-order polynomial and subtracted from all stellar, Th–Ar and flat images. The pixel-to-pixel sensitivity variations and interference fringes were taken into account in making the normalized flat image. The flat image was the median of 30 flat lamp images and the total flux for the flat image was 100 times greater than a single stellar image. All stellar and Th–Ar images were divided by the normalized flat image. The pixels across the dispersion axis at each wavelength were summed in each spectral order for stellar and Th–Ar images. The extracted one-dimensional spectra were wavelength calibrated by using the pre- and post-Th–Ar images and were Doppler-corrected to convert to the LSR wavelengths. The stellar spectra were then co-added and normalized to unity with a polynomial or cubic spline function. Since the rms noise in a featureless wavelength region is equivalent to the expected noise derived from the photon number, it appears unlikely that the final spectrum is affected by non-statistical errors.
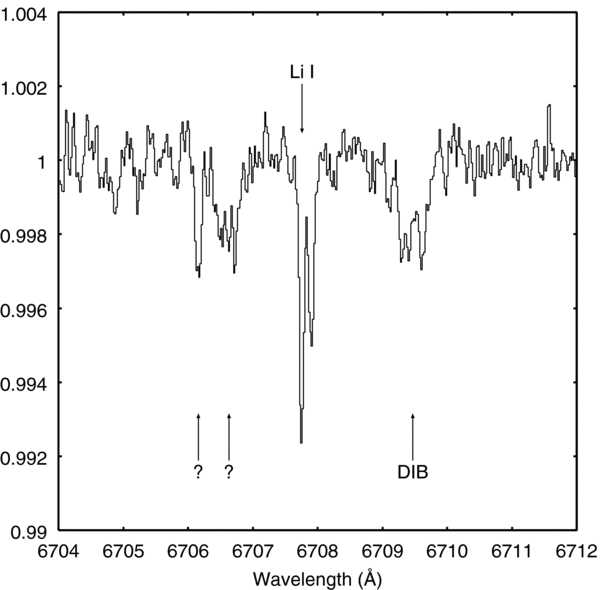
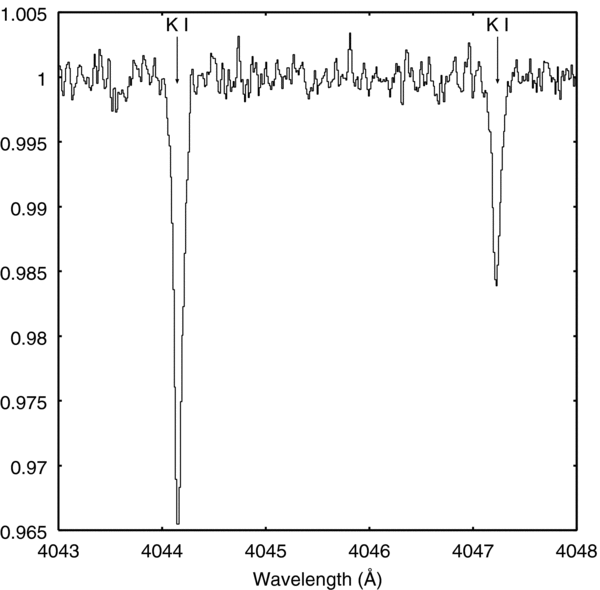
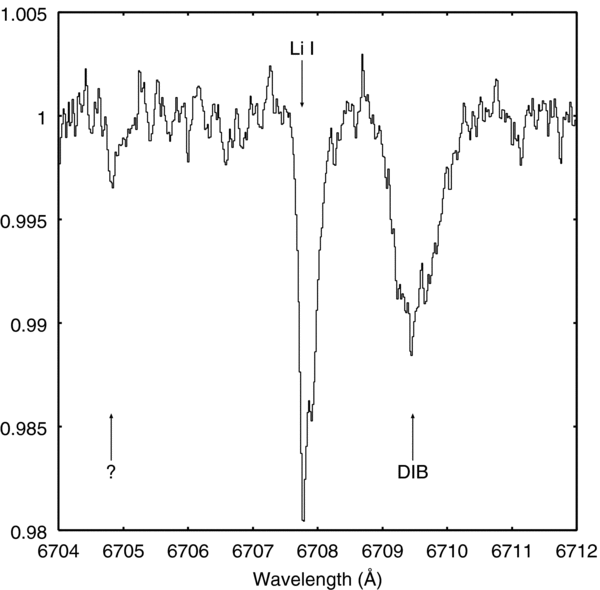
Figures 1–5 show normalized spectra in order to display the area around the Li i and K i absorption lines.
Figure 1. Spectrum around the Li i 6708 Å lines along the line of sight toward ζ Oph. A well known diffuse interstellar band (DIB) can be seen at 6709.5 Å. Two weak unidentified absorption features at 6706.1 Å and 6706.7 Å are also seen.
Download figure:
Standard image High-resolution imageFigure 2. Observed spectrum at K i 4044 Å and 4047 Å lines along the line of sight toward HD169454.
Download figure:
Standard image High-resolution imageFigure 3. Same as Figure 1, but for HD169454.
Download figure:
Standard image High-resolution imageFigure 4. Same as Figure 2, but for HD250290.
Download figure:
Standard image High-resolution imageFigure 5. Same as Figure 1, but for HD250290.
Download figure:
Standard image High-resolution image2.6. Diffuse Interstellar Bands (DIBs)
There are several DIB features observed around the Li i absorption lines at 6699.28, 6701.87, and 6709.65 Å, whose source species are not identified (Herbig 1995; Tuairisg et al. 2000). Their equivalent widths were shown to be 60, 27, and 10 mÅ by Herbig (1995) for HD183143. Tuairisg et al. (2000) reported equivalent widths for these DIB features of 41, 15, 16 mÅ and 48, 20, 13 mÅ for BD+63°1964 and HD183143, respectively. We also found these three DIB features clearly in the spectra for HD169454 and HD250290 at the expected positions with equivalent widths of 20, 10, 6 mÅ and 25, 15, 6 mÅ, respectively. Although no positive detection of the 6709.65 Å DIB feature has been reported for ζ Oph in the literature, we found the 6709.65 Å DIB feature as well as the other two DIB features at 6699.28 Å and 6701.87 Å as shown in Figure 1. Our measured equivalent widths were 3, 5, and 4 mÅ for ζ Oph. The relative strength of the 6699.28 Å DIB was exceptionally weak for ζ Oph compared with the other stars BD+63°1964, HD183143, HD169454, and HD250290. It should be noted that the broad wings of the DIB features do not affect the analysis of the Li i absorption line at all.
2.7. An Unidentified Feature at 6706 Å
We found an unknown feature at 6706.1 Å in the spectrum of ζ Oph (see Figure 1), although Lemoine et al. (1995) reported no corresponding feature in their higher resolution and higher S/N spectrum. We carefully inspected our flat-field images in detail and found a weak gray patch at the corresponding position ∼6706.1 Å. It is therefore likely that the flat fielding was not perfect or there is some non-linear response of pixels in the gray patch. We regard this weak absorption feature as artificial. We, however, confirmed that there is no CCD defect at the wavelength of the Li i absorption line.
3. DATA ANALYSIS
The 7Li- and 6Li-absorption lines overlap each other as described in Section 2. In addition, the line profile of each Li isotope itself is complicated due to doublets. Moreover, the observed Li line profile is presumed to be the superposition of a certain number of interstellar clouds with a variety of Doppler shifts. The K i line is invaluable for decomposing the contributions of individual clouds because K i 4044 Å and 4047 Å lines are singlets at our wavelength resolving power. We treated these K i lines as separated doublet with the strength ratio of 2:1.
In general, a Voigt profile is used to represent an absorption line. However, in our case, the absorption features are sufficiently weak that they can be reproduced by a Gaussian profile. Assuming that an absorption line can be represented by a simple Gaussian profile, there are three free parameters used to reproduce absorption line profile, equivalent width, line center wavelength, and Gaussian FWHM. We used an alternative equivalent parameter set to determine each line; equivalent width, radial velocity, and velocity spread parameter. In addition to these three parameters, we introduced a fourth parameter to define the Li isotopic ratio, 7Li/6Li. In order to find the absorption line parameters that minimize the χ2 between observations and synthetic profiles, we use an iterative process called the simulated annealing method (Metropolis et al. 1953). Line data which we use in the line profile fitting are based on Morton (2003) and are summarized in Table 3. To calculate reduced χ2, the S/N was defined by the apparent S/N, which is calculated from rms noise of the continuum. Since the photon number exceeded ∼106, we can assume photon-noise-limited observation in our data. However, the apparent S/N at the continuum was 10%–20% higher than the expected value, the square root of the photon number in 1 pixel at the continuum. That is probably caused by the rebinning process in data reduction. Although this small reduced χ2 should be compensated by reducing degree of freedom, we used apparent S/N instead of the expected S/N in calculating reduced χ2.
Table 3. Line Data
| Species | Air Wavelength (Å)a | gla | Fla | fa | log(λf)a | g*fb |
|---|---|---|---|---|---|---|
| 7Li i | 6707.7562 | 2 | 1 | 4.980 × 10⁻¹ | 3.524 | 3.735 × 10⁻¹ |
| 6707.7683 | 2 | 2 | 4.980 × 10⁻¹ | 3.524 | 6.225 × 10⁻¹ | |
| 6707.9068 | 2 | 1 | 2.490 × 10⁻¹ | 3.223 | 1.867 × 10⁻¹ | |
| 6707.9194 | 2 | 2 | 2.490 × 10⁻¹ | 3.223 | 3.112 × 10⁻¹ | |
| 6Li i | 6707.9219 | 2 | 4.980 × 10⁻¹ | 3.524 | 9.960 × 10⁻¹ | |
| 6708.0728 | 2 | 2.490 × 10⁻¹ | 3.223 | 4.980 × 10⁻¹ | ||
| 39K i | 4044.1422 | 2 | 5.680 × 10⁻³ | 1.361 | 1.136 × 10⁻² | |
| 4047.2132 | 2 | 2.641 × 10⁻³ | 1.029 | 5.282 × 10⁻³ |
Notes. aMorton (2003). bFor unresolved fine structure of 7Li and 6Li, the effective statistical weight g* = gl, as usual. For resolved hyperfine structure of 7Li, the effective statistical weight g* = (2Fl + 1)/4. Splitting less than 0.01 Å is omitted.
Download table as: ASCIITypeset image
We made 100 sets of artificial data based on the best-fit parameters of line fitting with random errors corresponding to the S/N to estimate errors in profile fitting by using a Monte Carlo approach. We plotted the results of profile fitting for the artificial data in parameter space and found 1σ errors for each parameter.
3.1. Analyses for Individual Objects
3.1.1. ζ Oph
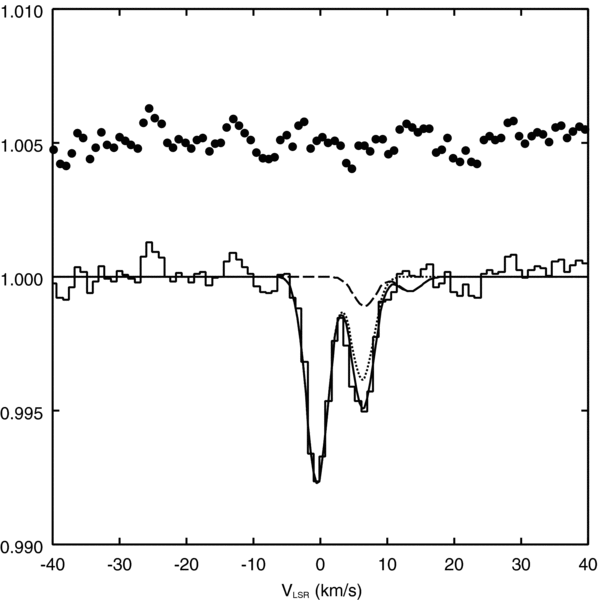
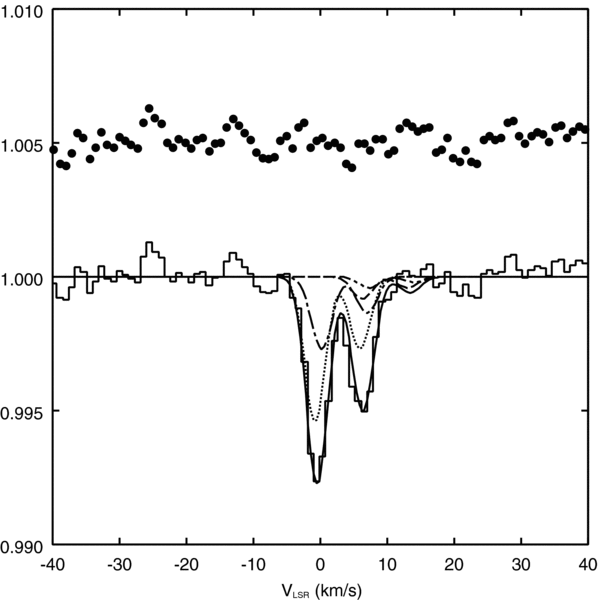
Although we do not have spectral data for K i, ζ Oph is well investigated as a background source of interstellar absorption and the velocity structure of the absorbing cloud toward ζ Oph was reported by several groups. Although the reported velocity structure toward ζ Oph shows some diversity, there are at least two velocity components of absorbing clouds in the line of sight toward ζ Oph. However, as the spectral resolving power of our observations cannot distinguish velocity components clearly, we assume a single velocity component absorber in the first analysis (model 1: Figure 6). Under this assumption, we find in model 1 the 7Li/6Li ratio of 7.1+2.9−1.6 (1σ).
Figure 6. Li i observed spectrum (histogram) toward ζ Oph with the best fit (solid line) in model 1. 7Li and 6Li components are shown as dotted and dashed lines, respectively. Residuals are shown as filled circles with an offset value of 1.005.
Download figure:
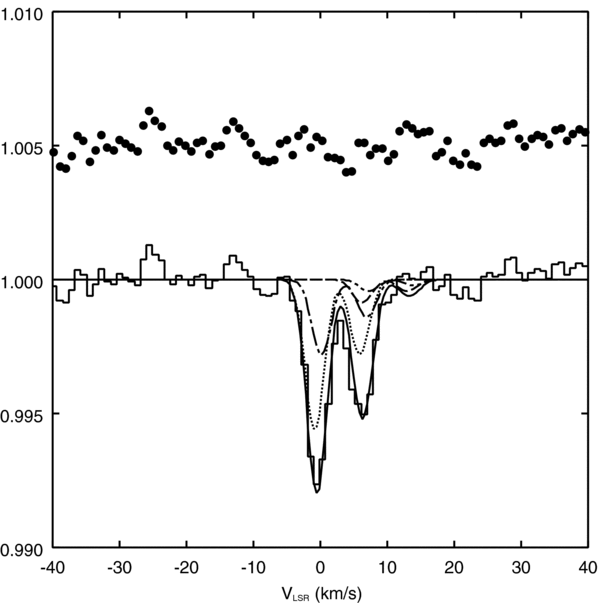
Standard image High-resolution imageThere are many literatures on the velocity components of ISMs in the line of sight toward ζ Oph. We chose recent papers to determine the velocity structure. Crawford (1997) reported two velocity components with separation of 1.1 km s−1 by using C2 molecular lines. Welty & Hobbs (2001) performed a survey for interstellar K i absorption and revealed that there are two strong components (comp. 3 and 4 in Table 2 of the reference) and three weak components (comp. 1, 2, and 5) in the line of sight, and, the reported value of the separation between the two strong components is 1.02 km s−1. Howarth et al. (2002) reported two velocity components in the line of sight toward ζ Oph with the separation of ∼1.0 km s−1. Knauth et al. (2003) showed that there are two velocity components in the line of sight and their separation is 1.04 km s−1. We therefore tried to introduce the second velocity component in second case (model 2: Figure 7) by adopting the following four constraints; a fixed velocity difference of 1.0 km s−1, a common b parameter, a fixed equivalent width ratio of 2.0 between the two velocity components and a common 7Li/6Li ratio. These constraints are introduced because the velocity resolution of our data is not sufficient to resolve this small velocity separation, 1.0 km s−1, and therefore, we cannot treat these all parameters independently. In this second model, we derived the isotopic ratio 6.6+2.5−1.5 (1σ), consistent with the value obtained in the first model assuming a single line component.
Figure 7. Li i observed spectrum (histogram) toward ζ Oph with the best fit (solid line) in model 2, main (dotted line) and weaker (dot-dashed line) components of 7Li, the main (dashed line) and weaker (double dot-dashed line) components of 6Li, respectively. Residuals are shown as filled circles with an offset value of 1.005.
Download figure:
Standard image High-resolution imageTo check the precision of our results, we compared our results with the previous works, Howarth et al. (2002) and Knauth et al. (2003). Since the velocity separation in our models was cited from previous works, we narrowed the comparison down to the column density and the b parameter. Howarth et al. (2002) and Knauth et al. (2003) estimate the total column density for Li i of 3.48 ± 0.09 × 109 cm−2 and 3.24 ± 0.14 × 109 cm−2, respectively. Our result, 3.56 ± 0.14 × 109 cm−2 for one component model, is similar to previous values. For the b parameter, there is some discrepancy between Howarth et al. (2002) and Knauth et al. (2003). The unconstrained fits in Howarth et al. (2002) show 1.1–1.2 km s−1 and the constrained fits for smaller b-value resulted in poorer matches to the data. Knauth et al. (2003) present the b-value of 0.65 and 0.57 km s−1 for two velocity components. Our b parameter 1.03 ± 0.23 is close to the value of Howarth et al. (2002). However, we cannot resolve this contradiction because the resolving power of our data is not sufficiently high. We tried to fit our data under the constraint of fixed b parameters derived by Knauth et al. (2003) as model 3 (Figure 8). The result is very similar to the case of model 2. So we conclude that the effect of small-scale velocity structure upon the isotopic ratio of Li is very small.
Figure 8. Li i observed spectrum (histogram) toward ζ Oph with the best fit (solid line) in model 3, main (dotted line) and weaker (dot-dashed line) components of 7Li, the main (dashed line) and weaker (double dot-dashed line) components of 6Li, respectively. Residuals are shown as filled circles with an offset value of 1.005.
Download figure:
Standard image High-resolution imageThe results of the profile fitting in models 1–3 are shown in Table 4.
Table 4. Result of Profile Fitting
| Star | Model | Species | VLSR (km s−1) | b (km s−1) | EW (mÅ) | N (109 cm−2) | 7Li/6Li | Reduced χ2 | Note |
|---|---|---|---|---|---|---|---|---|---|
| ζ Oph | 1 | 7Li i | −0.47 ± 0.08 | 1.26 ± 0.19 | 1.06 ± 0.04 | 3.56 ± 0.14 | 31.7/31 | ||
| 6Li i | −0.47 ± 0.08 | 1.26 ± 0.19 | 0.15 ± 0.04 | 0.50 ± 0.14 | 7.1+2.9−1.6 | ||||
| 2 | 7Li i | −0.81 ± 0.08 | 1.03 ± 0.23 | 0.70 ± 0.03 | 2.35 ± 0.10 | 31.7/31 | |||
| 6Li i | −0.81 ± 0.08 | 1.03 ± 0.23 | 0.11 ± 0.03 | 0.37 ± 0.10 | 6.6+2.5−1.5 | ||||
| 7Li i | +0.19 ± 0.08 | 1.03 ± 0.23 | 0.35 ± 0.01 | 1.18 ± 0.04 | |||||
| 6Li i | +0.19 ± 0.08 | 1.03 ± 0.23 | 0.06 ± 0.01 | 0.20 ± 0.04 | |||||
| 3 | 7Li i | −0.85 ± 0.08 | 0.65 | 0.78 ± 0.03 | 2.62 ± 0.10 | 36.9/32 | |||
| 6Li i | −0.85 ± 0.08 | 0.65 | 0.12 ± 0.03 | 0.40 ± 0.10 | 6.5+2.5−1.5 | ||||
| 7Li i | +0.15 ± 0.08 | 0.57 | 0.39 ± 0.01 | 1.31 ± 0.04 | |||||
| 6Li i | +0.15 ± 0.08 | 0.57 | 0.06 ± 0.01 | 0.20 ± 0.04 | |||||
| HD169454 | 1 | K i | +4.92 ± 0.06 | 1.97 ± 0.12 | 2.53 ± 0.07 | 4.63 ± 0.13 × 10⁴ | 93.4/76 | ||
| 7Li i | +4.76 ± 0.14 | 3.15 ± 0.16 | 1.81 ± 0.06 | 6.08 ± 0.20 | 66.2/46 | ||||
| 6Li i | +4.76 ± 0.14 | 3.15 ± 0.16 | 0.22 ± 0.06 | 0.74 ± 0.20 | 8.1+3.6−1.8 | ||||
| 2 | K i | +4.52 ± 0.06 | 0.44 | 1.29 ± 0.07 | 2.36 ± 0.13 × 10⁴ | 93.7/76 | |||
| +5.22 ± 0.06 | 0.36 | 1.29 ± 0.07 | 2.36 ± 0.13 × 10⁴ | ||||||
| 7Li i | +4.41 ± 0.14 | 0.44 | 0.90 ± 0.06 | 3.02 ± 0.20 | 66.3/46 | ||||
| 6Li i | +4.41 ± 0.14 | 0.44 | 0.11 ± 0.06 | 0.37 ± 0.20 | 8.1+3.6−1.8 | ||||
| 7Li i | +5.11 ± 0.14 | 0.36 | 0.90 ± 0.06 | 3.02 ± 0.20 | |||||
| 6Li i | +5.11 ± 0.14 | 0.36 | 0.11 ± 0.06 | 0.37 ± 0.20 | |||||
| HD250290 | 1 | K i | +0.90 ± 0.11 | 3.52 ± 0.14 | 4.80 ± 0.14 | 8.78 ± 0.26 × 10⁴ | 53.1/76 | ||
| +6.75 ± 0.35 | 1.42 ± 0.70 | 0.50 ± 0.14 | 0.92 ± 0.26 × 10⁴ | ||||||
| 7Li i | +0.64 ± 0.09 | 3.35 ± 0.11 | 4.21 ± 0.10 | 14.15 ± 0.33 | 21.4/28 | ||||
| +6.50 ± 0.09 | 2.55 ± 1.02 | 0.20 ± 0.20 | 0.67 ± 0.67 | ||||||
| 6Li i | +0.64 ± 0.09 | 3.35 ± 0.11 | 0.69 ± 0.23 | 2.32 ± 0.77 | 6.3+3.0−1.7 | Main comp. | |||
| +6.50 ± 0.09 | 2.55 ± 1.02 | 0.43 ± 0.08 | 1.45 ± 0.26 | 0.5+0.6−0.5 | Sub comp. | ||||
| 2 | K i | +0.61 ± 0.13 | 3.28 ± 0.15 | 4.33 ± 0.16 | 7.92 ± 0.29 × 10⁴ | 60.1/77 | |||
| +5.61 ± 0.44 | 3.28 ± 0.15 | 0.98 ± 0.14 | 1.79 ± 0.26 × 10⁴ | ||||||
| 7Li i | +0.52 ± 0.10 | 3.28 ± 0.13 | 3.92 ± 0.12 | 13.17 ± 0.40 | 54.6/30 | ||||
| +5.52 ± 0.10 | 3.28 ± 0.13 | 0.51 ± 0.20 | 1.71 ± 0.67 | ||||||
| 6Li i | +0.52 ± 0.10 | 3.28 ± 0.13 | 0.78 ± 0.16 | 2.62 ± 0.54 | 5.0+1.5−1.0 | Main comp. | |||
| +5.52 ± 0.10 | 3.28 ± 0.13 | 0.10 ± 0.02 | 0.34 ± 0.07 | Sub comp. | |||||
Download table as: ASCIITypeset image
3.1.2. HD169454
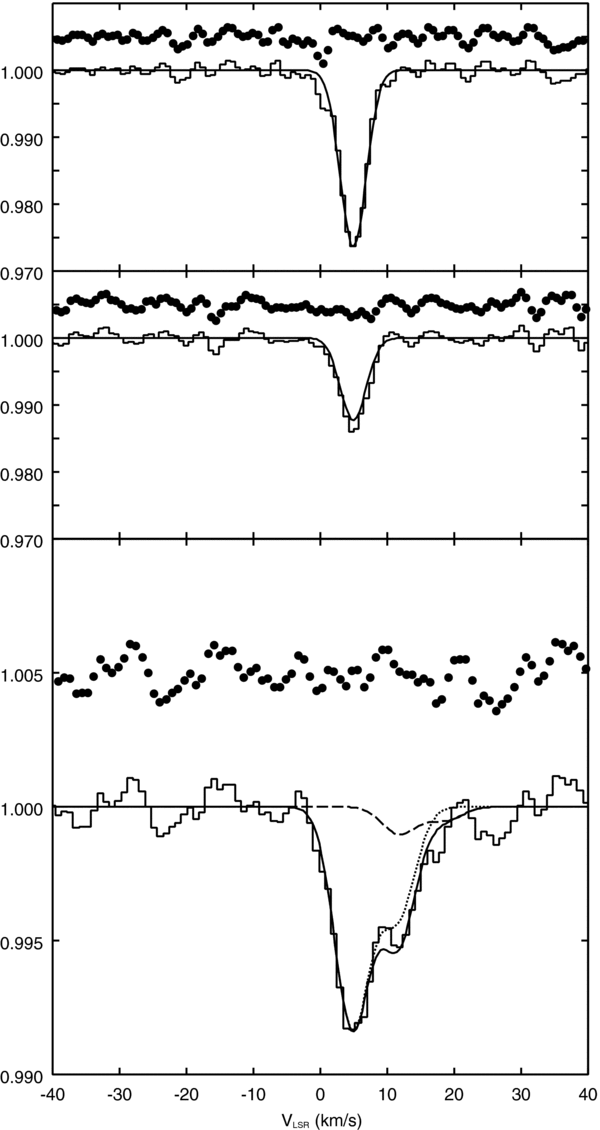
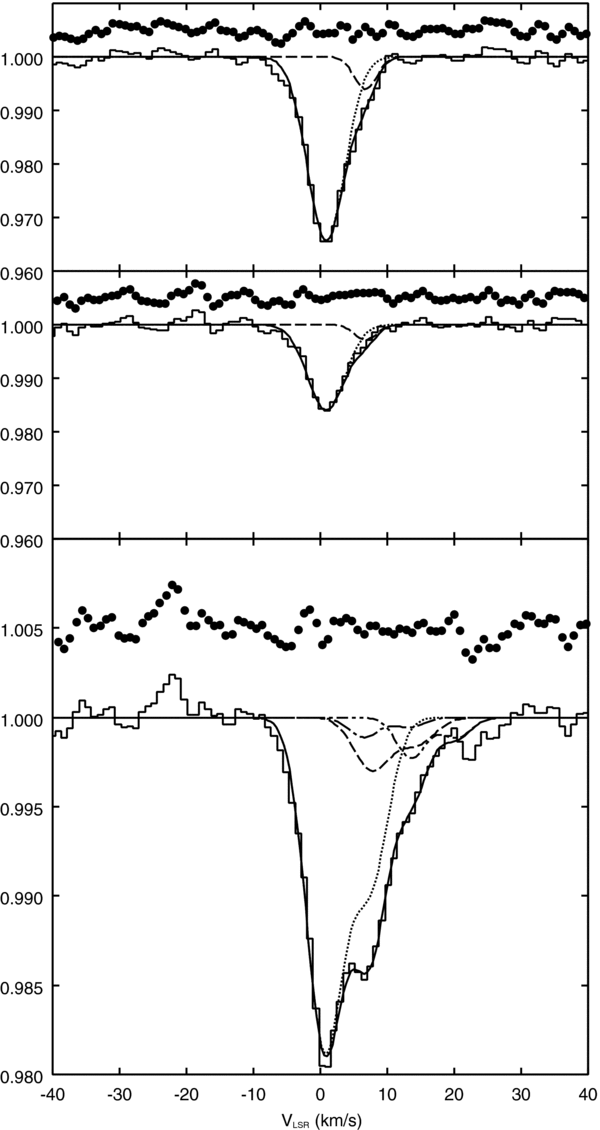
In analyzing HD169454, K i lines at 4044 Å and 4047 Å were used to determine the velocity components. These lines are a doublet pair and the intensity ratio of these lines is about 2:1. Although a weak absorbing structure may be claimed to be seen in the blue wing of the main velocity component at 4044 Å, we consider that there is only one absorbing cloud because there is no feature observed in the blue wing of 4047 Å line (see Figure 9). The residual of the profile fitting is comparable with the S/N of these data. The result of the profile fitting (model 1) is shown in Table 4. We find the 7Li/6Li ratio of 8.1+3.6−1.8(1σ).
Figure 9. Top and middle panel: the K i 4044 Å and 4047 Å lines toward HD169454 with the best fit (solid line) in model 1. Residuals are shown as filled circles with an offset value of 1.005. Bottom panel: the Li i 6708 Å lines toward HD169454 with the best fit (solid line) in model 1. 7Li and 6Li components are shown as dotted and dashed lines, respectively. Residuals are shown as filled circles with an offset value of 1.005.
Download figure:
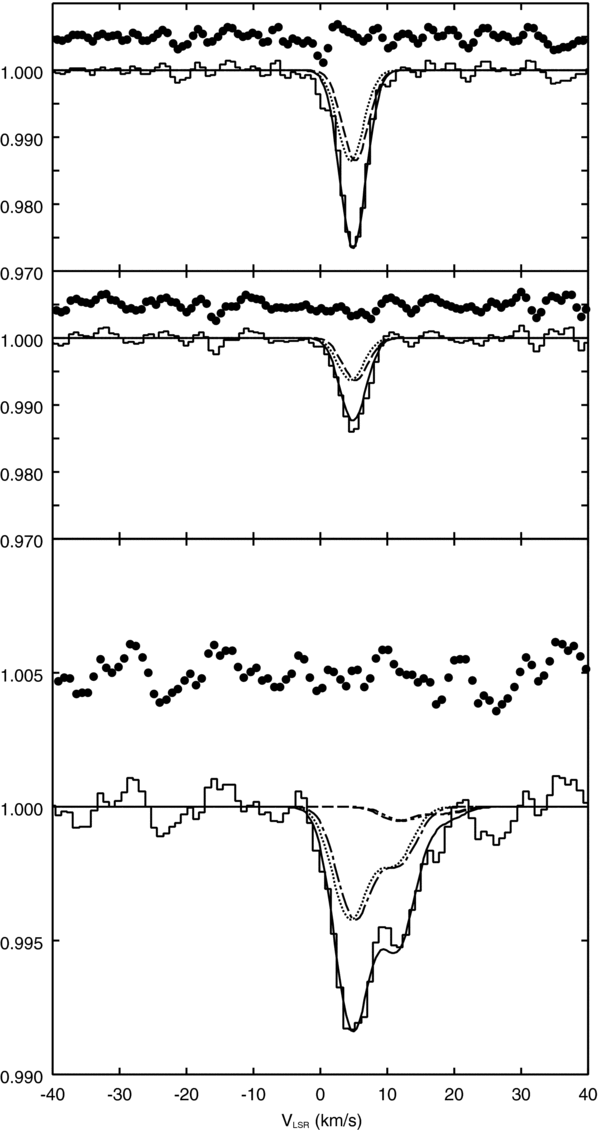
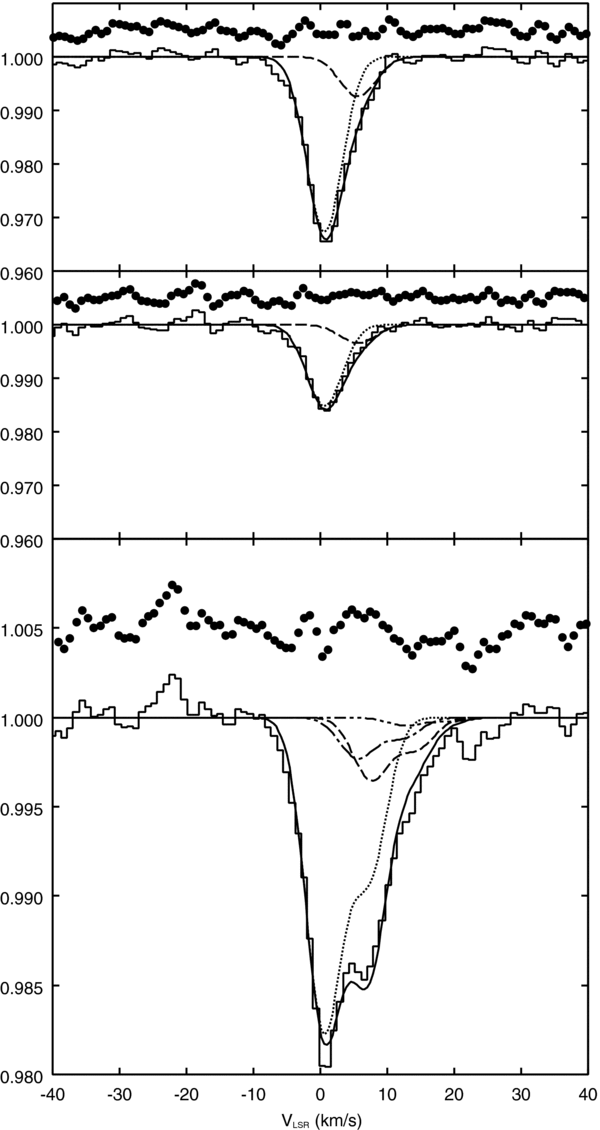
Standard image High-resolution imageAccording to Crawford (1997), there are two components of absorber separated by 0.7 km s−1 with b-values 0.36 ± 0.03 km s−1 and 0.44 ± 0.07 km s−1 along the line of sight toward HD169454. We tried to introduce these parameters in our analysis. Because there is no information about strength of metallic line absorption of each velocity components, we used the velocity separation and b parameters derived from molecular absorption for K i and Li i lines and assumed that strength of two velocity components is the same. In this case (model 2), we obtained about the same values as that of model 1. The result of the profile fitting (model 2) is also shown in Figure 10 and Table 4.
Figure 10. Top and middle panel: the K i 4044 Å and 4047 Å lines toward HD169454 with the best fit (solid line) in model 2, two components separating 0.7 km s−1 are shown as dotted and broken line. Residuals are shown as filled circles with an offset value of 1.005. Bottom panel: the Li i 6708 Å lines toward HD169454 with the best fit (solid line) in model 2, two 7Li components are shown as dotted and dot-dashed lines and two 6Li components are shown as dashed and double dot-dashed lines. Residuals are shown as filled circles with an offset value of 1.005.
Download figure:
Standard image High-resolution imageFor this star, there are few previous observational works on Li i absorption. Only White (1986) reported the upper limit of equivalent width of Li i interstellar absorption. The value of the upper limit is <4.5 mÅ and is consistent with our result of 2.0 mÅ for 7Li i + 6Li i.
3.1.3. HD250290
The K i lines at 4044 Å and 4047 Å are used in a similar way to those of HD169454. Since a weak component is detected at the red wing of the main component, we assumed two velocity components for HD250290 (model 1). The model is compared with the observed data in Figure 11. Two velocity components are assumed for the Li i lines, too. We find the 7Li/6Li ratio of the main component 7Li/6Li = 6.3+3.0−1.7(1σ). The isotopic ratio derived by using the secondary velocity component is excluded from our final results, because of its extremely large error caused by the weakness of the line.
Figure 11. Top and middle panels: the K i 4044 Å and 4047 Å lines toward HD250290 with the best fit (solid line) in model 1, main (dotted line) and weaker (broken line) component. Residuals are shown as filled circles with an offset value of 1.005. Bottom panel: the Li i 6708 Å lines toward HD250290 with the best fit (solid line) in model 1, main (dotted line) and weaker (dot-dashed line) components of 7Li, the main (dashed line) and weaker (double dot-dashed line) components of 6Li, respectively. Residuals are shown as filled circles with an offset value of 1.005.
Download figure:
Standard image High-resolution imageAlthough the values from the secondary component are not adopted in the final results, the effects on the analysis of the first component should be taken into consideration. The resultant isotopic ratio 7Li/6Li = 0.5+0.6−0.5 for the secondary weak component is unexpectedly small. Theoretically, it should be ∼2 larger in the extreme case that only the GCR–ISM interactions contribute to both 6Li and 7Li. Such a small ratio for the secondary weak component was reported by Lemoine et al. (1995) for ζ Oph, too, as summarized in Table 5. We therefore made another model analysis (model 2) that assumes the same isotopic ratio for both main and secondary components. In this analysis, we also adopted the following reasonable assumptions as we did for ζ Oph; a fixed velocity difference of 5.0 km s−1 and a common b parameter. The model is compared with the observed data in Figure 12. The inferred ratio turns out to be 7Li/6Li = 5.0+1.5−1.0 with a larger reduced χ2 of 54.6/30. Similarly to the first model analysis, the b parameter for 6Li and 7Li is almost the same as that for K i, which suggests that the bulk motion dominates over the thermal motion in the clouds or the clouds have more unresolved velocity components. Higher resolution and higher S/N data are required for resolving this unexpected result.
Figure 12. Same as Figure 11, but with the best fit in model 2.
Download figure:
Standard image High-resolution imageTable 5. Compiled Observational Data
| Star | 7Li/6Li | 7Li/6Li Error | (l, b) | d (kpc) | RG (kpc)a | Refs.b |
|---|---|---|---|---|---|---|
| ζ Oph | 38.5c | (+141.5, − 13.5) | (6.3, + 23.6) | 0.14 | 8.37 | (1) |
| 13.8c | (+∞, − 4.8) | (1) | ||||
| 6.8d | (+1.4, − 1.7) | (3) | ||||
| 8.6e | (+2.2, − 2.2) | (4) | ||||
| 1.4f | (+1.8, − 1.1) | (4) | ||||
| 13.2d | (+7.7, − 4.9) | (6) | ||||
| ⩾12.0e | (7) | |||||
| ⩾11.7f | (7) | |||||
| 7.1d | (+2.9, − 1.6) | This work | ||||
| ρ Oph | 12.5 | (+4.3, − 3.4)g | (353.7, + 17.7) | 0.12 | 8.39 | (2) |
| ζ Per | 5.5 | (+1.3, − 1.1) | (162.3, − 16.7) | 0.30 | 8.77 | (3) |
| 10.6 | (+2.9, − 2.9) | (5) | ||||
| o Per | 3.6e,h | (+0.6, − 0.6) | (160.4, − 17.7) | 0.45 | 8.91 | (5) |
| 1.7f,h | (+0.3, − 0.3) | (5) | ||||
| 8.1e | (+2.1, − 2.1) | (7) | ||||
| 2.1f | (+1.1, − 1.1) | (7) | ||||
| χ Oph | 7.6 | (+4.8, − 4.8) | (357.9, + 20.7) | 0.15 | 8.36 | (7) |
| 20 Aql | ⩾9.4e | (28.2, − 8.3) | 0.37 | 8.17 | (7) | |
| ⩾5.6f | (7) | |||||
| HD169454 | 8.1 | (+3.6, − 1.8) | (17.5, − 0.7) | 1.7i | 6.8 | This work |
| HD250290 | 6.3e | (+3.0, − 1.7) | (186.6, + 0.1) | 2.2, 0.44i | 10.7, 8.94 | This work |
Notes. aRadius of the solar circle assumed to be 8.5 kpc. bReferences. (1) Ferlet & Dennefeld 1984, (2) Lemoine et al. 1993, (3) Meyer et al. 1993, (4) Lemoine et al. 1995, (5) Knauth et al. 2000, (6) Howarth et al. 2002, and (7) Knauth et al. 2003. cOmitted from discussions because of their extremely large errors. See the text for details. dSingle component fitting is used. eThe main velocity component. fThe secondary weaker velocity component. Omitted from discussions because of weakness of absorption. gErrors at 95% CL. hOmitted from discussions because same authors (7) published the revised value of 7Li/6Li. iSee Table 1.
Download table as: ASCIITypeset image
All results of the profile fitting are summarized in Table 4.
We mention an uncertainty in the isotopic ratio for this star. Since there is no higher resolution data for HD250290, the isotopic ratio may contain larger uncertainty than those for ζ Oph and HD169454. Assuming that the difference between observed isotopic ratios toward ζ Oph and HD169454 represents the systematic uncertainty of the ratio, the value 1.0 should be added in quadrature with the uncertainties from the fitting procedure. In this case, the confidence interval of the isotopic ratio becomes 7Li/6Li = 6.3+3.2−2.0.
4. RESULT AND DISCUSSIONS
4.1. Comparison with Previous Data
We summarize the previous observations of the 7Li/6Li isotopic abundance ratio in Table 5 together with the present results for ζ Oph, HD169454, and HD250290. The distances shown in Table 5 for the previous data are based on HIPPARCOS parallaxes (Perryman et al. 1997) of background stars and the Galactocentric distance refers to the radius of the solar circle of 8.5 kpc. For our data, the distance of background stars are discussed in Sections 2.2.2 and 2.2.3. However, we adopted 0 kpc as the distance for all absorbing clouds for safety.
We use only data that have both upper and lower detection limits for the 7Li/6Li abundance ratio in the following discussions. In the cases where the observed spectrum exhibits more than one velocity component, we use the dominant component, because the dominant component can be treated as a representative in each direction by their strong absorption. Other components have such weak absorption lines superimposed upon the main strongest component that the identification of the abundance ratio becomes less reliable. We thus do not use the isotopic abundance ratios in discussion if they are derived from the secondary velocity component, as for o Per (Knauth et al. 2003) and ζ Oph (Lemoine et al. 1995) because they are the results from subtle analysis of very weak component with extremely low column density in overlapping main component. We also do not use the data of Ferlet & Dennefeld (1984) because their result has extremely large error bars as indicated in Table 5.
Our new data are in reasonable agreement with the mean value of those observed previously in the solar neighborhood within ±2σ error bars. This agreement is robust evidence for homogeneous mixing and instantaneous recycling of the gas component in the Galactic disk.
4.2. Different Production Sources of 7Li
Many theoretical and observational studies of the GCE indicate that the 6Li abundance in the ISM gas clouds near the solar neighborhood is entirely synthesized by GCR interactions with the ISMs. However, 7Li has three different production sources: (1) similarly to 6Li, GCR spallation and α + α fusion (Ramaty et al. 1997, 2000; Yoshii et al. 1997; Suzuki et al. 1999; Fields et al. 2000); (2) stellar nucleosyntheses in Type II SNe (Woosley et al. 1990; Woosley & Weaver 1995), in novae (José et al. 2003) and in AGB stars (Forestini & Charbonnel 1997); and (3) BBN (Wagoner 1973; Yang et al. 1984). The observed 7Li/6Li ratio can thus be written as

Since we do not have definite evidences to argue about distance of absorbing clouds, we assume that the (7Li/6Li)obs is independent of RG in this subsection. The mean-weighted average of all observed data in Table 5 including ours is (7Li/6Li)obs = 7.6 ± 2.3(1σ). Let us try to decompose this into several production sources of 7Li.
Knauth et al. (2003) adopted an approach to seek for constraints on the stellar source for 7Li by adopting a primordial abundance of 7Li/H = 1.23 × 10⁻¹⁰ in addition to the GCR term unambiguously known. Cosmological observations of the CMB anisotropies (Spergel et al. 2003, 2007), however, invoked a potential difficulty that their assumption of the primordial 7Li abundance may not be a unique one, as discussed in Section 1. We therefore adopt another approach here that is to estimate by all means the first GCR term and the second stellar term in order to infer the third BBN term.
The first term on the right-hand side of Equation (1) takes a constant value of 7LiGCR/6LiGCR = 1.5 ± 0.3 almost independent of the GCE model (Ramaty et al. 2000; Austin 1981). This is because the ratio is determined by the observed GCR energy spectrum and the measured spallation and α + α fusion cross sections.
The second term is calculated theoretically in our GCE model by using stellar nucleosynthesis yields of 7Li from several different sources divided by the ISM 6Li abundance of 6Li/H = 3.4 × 10⁻¹⁰ (Suzuki et al. 1999; Kawanomoto 2002). The stellar term is estimated to be 7LiSTAR/6LiGCR = 5.4 ± 1.6.
The estimated error bars Δ7LiSTAR/6LiGCR = ±1.6 are inferred from the following comparison among different GCE model calculations. In our GCE model, the calculated stellar lithium abundance in the current ISM gas clouds at time t = 13.5 Gy is 7Li/H = 2.6 × 10⁻⁹, which is slightly larger than the solar abundance of 7Li/H = 1.9 × 10⁻⁹ at time t = 9 Gy for solar system formation because of extensive gas-phase evolution during the last 4.5 Gy. Note that the meteoritic lithium abundance is known to be (6Li/H + 7Li/H)☉ = 2.04 × 10⁻⁹ (Anders & Grevesse 1989), leading to (7Li/H)☉ = 1.89 × 10⁻⁹ and (6Li/H)☉ = 1.53 × 10⁻¹⁰ by taking account of meteoritic (7Li/6Li)☉ = 12.3 ± 0.2. Our stellar 7Li/H abundance value is ∼15% smaller than that predicted by Romano et al. (2003) and their value is ∼30% different from their previous theoretical estimate (Romano et al. 2001) in similar GCE modeling which assumed a different BBN 7Li abundance predicted in the standard BBN theory for the ΩB-value taken from the CMB–WMAP data. Our GCE model (Suzuki et al. 1999; Kawanomoto 2002) is different from Romano et al. (2001, 2003) in that the latter model included a contribution from low-mass red giants in addition to our production sources of Type II SNe, novae and AGB stars. It is also to be noted that the referred stellar nucleosynthesis yields and each contribution are different from each other. Nevertheless, the difference between the resultant stellar 7Li abundance is no more than ∼30%. This is because both the measured meteoritic lithium abundance (6Li/H + 7Li/H)☉ = 2.04 × 10⁻⁹ (Anders & Grevesse 1989) and the uppermost envelope of the stellar lithium abundances of population I stars (e.g., Ryan et al. 2001) impose strong constraints on the GCE of lithium in the ISM gas clouds. This fact applies to many other GCE models too. We can therefore estimate systematic theoretical error bars of ±30% for the second stellar 7Li production term in Equation (1). Since the ISM 6Li abundance, 6Li/H = 3.4 × 10⁻¹⁰, is thought to be produced entirely from GCR spallation and α + α fusion and its associated error bars are small, we finally end up with 7LiSTAR/6LiGCR = 5.4 ± 1.6(sys), where we take the theoretical uncertainties Δ7LiSTAR/6LiGCR = ±1.6 as the systematic error bars.
The third primordial term can be determined by subtracting the first and second terms from the observed value (7Li/6Li)obs = 7.6 ± 2.3(1σ): 7LiBBN/6LiGCR = 0.7+2.3−0.7(1σ) ± 1.6(sys). Multiplying by the ISM 6Li abundance, we can estimate the corresponding primordial abundance of 7Li to be 7Li/H = 2.4+7.8−2.4(1σ) ± 5(sys) × 10−10.
4.3. Lithium Distribution in the Galaxy
Although we assumed a "flat" distribution of the 7Li/6Li ratio in the Galactic disk in the last section, there is a clear observational evidence that indicates radial variation of other elemental abundances over 6 kpc ⩽ RG ⩽ 18 kpc (Rolleston et al. 2000). Concerning isotopic ratios, Penzias (1979) reported that the D/H abundance ratio shows an appreciable gradient with respect to RG from the Galactic center to outside the solar orbit, i.e., 0 kpc ⩽RG⩽12 kpc, with an anomaly in D/H near the Galactic center (Wannier 1980; Lubowich et al. 2000). Recent observational studies of D/H in the local ISM reported a uniform single value D/H ∼ 1.5 × 10⁻⁵ within the Local Bubble (Moos et al. 2002; Oliveira et al. 2003), although variations of factors of 2 or so is also observed in the distant ISM beyond the Local Bubble (Hébrard & Moos 2003; Wood et al. 2004; Hébrard et al. 2005; Friedman et al. 2006). From a theoretical viewpoint, Prantzos (1996) proposed a chemical evolution model of the Galactic disk with each ring of appropriate width at different Galactocentric distance RG evolving independently under an assumption of homogeneous mixing and instantaneous recycling of the ISM. His model predicted D/H ≃ 1.5 × 10⁻⁵ at 13.5 Gy in the solar neighborhood which is in reasonable agreement with the average of observed D/H. The GCE models (Prantzos 1996; Romano et al. 2003) indicate a rather steep gradient of the abundance ratios D/H and 3He/H at 5 kpc ⩽ RG ⩽ 15 kpc and satisfy an extremely depleted D/H ratio as observed in the Galactic center (Lubowich et al. 2000).
Prantzos' GCE model applies also to the chemical evolution of metals over a wide range of RG so that it describes the observed isotopic abundance ratios such as 12C/13C, 14N/15N, 16O/18O, etc. Remarkable gradients of the carbon isotopic ratios are reported by Savage et al. (2002) and Milam et al. (2005). A comprehensive review on isotopes in the ISM presented by Wilson (1999) concluded that there is a gradient in the isotopic ratio of carbon, nitrogen, and oxygen. Tosi (1982) tried to reproduce the observed radial distribution of the metal abundances in a GCE model with minimum assumptions on theoretical parameters. She suggested steeper gradients of metal abundance ratios in the outer parts of the Galaxy. We cannot expect a steep gradient in 7Li/6Li because the second stellar term and the third BBN term offset their RG dependence made by the star-formation efficiency and the GCR intensity in each term.
If we obtain 7Li/6Li data in wide range of RG similar to other elements, we can discuss the gradient of 7Li/6Li ratio and proportions of the second stellar term and the third BBN term in the isotopic ratio in detail.
5. CONCLUSION
We reported observations of the interstellar λ6708 Å Li i absorption lines obtained using the Subaru Telescope with spectral resolution of ∼100,000. The S/N performance was more than 1500 pixel−1. We could determine the 7Li/6Li isotopic abundance ratio on the basis of high-quality data of ISM gas clouds along the line of sight to HD169454 and HD250290 which are firstly observed for this purpose. In addition, the isotopic ratio for the nearby cloud along the line of sight to ζ Oph was measured as a reference. The simulated annealing method, that can find the global minimum appropriately, was used to fit the absorption profile. We obtained values of the 7Li/6Li isotopic ratio at 1σ error, 7.1+2.9−1.6, 8.1+3.6−1.8, and 6.3+3.0−1.7 for ζ Oph, HD169454, and HD250290, respectively.
These values were compared with previous data for the local gas clouds near the Sun, and we found our observed ratios to be in reasonable agreement within ±2σ error bars. This is evidence for homogeneous mixing of the gas component in the Galactic disk. Assuming homogeneous 7Li/6Li ratio of each contribution from the GCR–ISM interactions (7LiGCR/6LiGCR), stellar nucleosynthesis (7LiSTAR/6LiGCR), and BBN (7LiBBN/6LiGCR), we inferred 7LiBBN/6LiGCR = 0.7+2.3−0.7(1σ) ± 1.6(sys), suggesting a primordial 7Li abundance of 7Li/H = 2.4+7.8−2.4(1σ) ± 5(sys) × 10−10. This conservative constraint indicates that the 7Li abundance observed in the metal-deficient halo dwarfs cannot be depleted by more than a factor of ∼10 due to astration.
Successful determination of Ωb-value from the WMAP data of CMB anisotropies (Spergel et al. 2003, 2007) implies a serious potential problem that the stellar 7Li abundance in old population II dwarfs is almost three times smaller than that predicted in BBN. It is therefore even more important to constrain the primordial 7Li abundance which should be free from stellar depletion process. Although we cannot find a clear RG dependence of 7Li/6Li, we expect that more precise determination of the lithium isotopic ratio (7Li/6Li)obs over the wider range of RG than the present study may exhibit the gradient as suggested theoretically. This would serve to infer a more reliable value of the primordial 7Li abundance independently of stellar depletion effects that confront the identification of the primordial value from the Spite plateau in population II stars. A primordial 7Li abundance that is totally free from the stellar depletion process should directly test the cosmological models for the BBN (Coc et al. 2004; Spergel et al. 2003; Kajino & Boyd 1990) and the particle theory of weak interactions and dark matter (Mathews et al. 2005; Ellis et al. 2005; Kusakabe et al. 2006, 2007, 2008).
The data for HD169454 and HD250290 were obtained during the commissioning phase of HDS. The data for ζ Oph were obtained as reference data in a program on the stellar Li isotopes (PI: S. Inoue). This work has been supported in part by Grants-in-Aid for Scientific Research (17540275, 20244035) of the Ministry of Education, Culture, Sports, Science and Technology of Japan, JSPS Core-to-Core Program of International Research Network for Exotic Femto Systems (EFES), and the Mitsubishi Foundation.
Footnotes
- *
Based on data collected at Subaru Telescope, which is operated by the National Astronomical Observatory of Japan.
- 11
IRAF is distributed by National Optical Astronomy Observatory, which is operated by the Association of Universities for Research in Astronomy, Inc., under cooperative agreement with the National Science Foundation.


