


ABSTRACT
We present our latest results on near- to mid-infrared (MIR) observation of supernova (SN) 2006jc at 200 days after the discovery using the Infrared Camera (IRC) on board AKARI. The near-infrared (2–5 μm) spectrum of SN 2006jc is obtained for the first time and is found to be well interpreted in terms of the thermal emission from amorphous carbon of 800 ± 10 K with the mass of 6.9 ± 0.5 × 10⁻⁵ M☉ that was formed in the SN ejecta. This dust mass newly formed in the ejecta of SN 2006jc is in a range similar to those obtained for other several dust-forming core-collapse supernovae based on recent observations (i.e., 10−3–10−5 M☉). MIR photometric data with AKARI/IRC MIR-S/S7, S9W, and S11 bands have shown excess emission over the thermal emission by hot amorphous carbon of 800 K. This MIR excess emission is likely to be accounted for by the emission from warm amorphous carbon dust of 320 ± 10 K with the mass of 2.7+0.7−0.5 × 10⁻³ M☉ rather than by the band emission of astronomical silicate and/or silica grains. This warm amorphous carbon dust is expected to have been formed in the mass-loss wind associated with the Wolf–Rayet stellar activity before the SN explosion. Our result suggests that a significant amount of dust is condensed in the mass-loss wind prior to the SN explosion.
Export citation and abstract BibTeX RIS
1. INTRODUCTION
Study on the dust formation in the ejecta of core-collapse supernovae (SNe) is an important topic in exploring the origin of dust in the early universe. Besides the theoretical studies that suggest the dust condensation in the ejecta of core-collapse SNe (Kozasa et al. 1991; Todini & Ferrara 2001), several pieces of the observational evidence for the dust formation in supernova (SN) ejecta have so far been reported. For example, up to 0.02 M☉ of dust formation, which is close to the value of 0.1 M☉ needed for core-collapse SNe to account for the dust content of high-redshift galaxies (Morgan & Edmunds 2003), in the ejecta of the Type II SN 2003gd has been reported by Sugerman et al. (2006).
As for the case of the Type II SN 1987A, however, even the highest estimate of the condensed mass in the SN ejecta reaches only up to 7.5 × 10⁻⁴ M☉ (Ercolano et al. 2007). Moreover, there is an alternative estimate for the newly condensed dust mass in the ejecta of SN 2003gd of 4 × 10⁻⁵ M☉ by Meikle et al. (2007) based on different modeling analysis from that of Sugerman et al. (2006). Spitzer Multiband Imaging Photometer (MIPS) observations of the Galactic core-collapse SN remnant Cassiopeia A (Cas A) show that the dust mass associated with it is much smaller (∼0.003 M☉) than previously thought (Hines et al. 2004), while a recent Spitzer Infrared Spectrograph (IRS) mapping observation (Rho et al. 2008) reports that the total mass formed in Cas A should be at least 0.02 M☉. There still remains a gap in the produced dust mass in core-collapse SN ejecta between those observational results and the theoretical prediction of 0.1–1 M☉ (Nozawa et al. 2003).
SN 2006jc is a peculiar Type Ib SN and was discovered on 2006 October 9.75 (UT) (Nakano et al. 2006). It is believed that the progenitor star had experienced a luminous outburst similar to those of luminous blue variables (LBVs) two years prior to the SN event (Pastorello et al. 2007; Foley et al. 2007). Evidence of substantial interaction of the SN ejecta with a dense He-rich circumstellar medium (CSM) ejected during the LBV-like eruption was reported based on Chandra X-ray observations (Immler et al. 2008).
Recent observational studies on this SN have shown that SN 2006jc is an interesting target for the study of dust-forming massive star SNe. The near-infrared (NIR) rebrightening of SN 2006jc was firstly reported by Arkharov et al. (2006) from late 2006 November through early December (∼50 days after the discovery) based on J-, H-, and K-band observations. Smith et al. (2008) report that both the appearance of a strong continuum emission at red/NIR wavelengths and the fading of redshifted sides of the narrow He i emission lines occurred simultaneously between 51 and 75 days after the brightness peak. These characteristics are interpreted as the evidence for dust formation in SN 2006jc, although the timescale is much shorter than the general dust formation timescale, at least a few hundred days, typical of other dust-forming SNe. They found that graphite grains with T ∼ 1600 K or slightly hotter silicate grains well fit the optical(red) spectrum of day 75, pointing out that the dust is mainly carbon and not silicate because of its high temperature.
While most of the dust-forming SNe that have been observationally reported are Type II except for the case of Type Ib SN 1990I (Elmhamdi et al. 2004), the Type Ib SN 2006jc gives us a unique opportunity to investigate the dust formation not only in the SN ejecta, but also in rich circumstellar materials that have come from the mass-loss events prior to final core collapse. NIR to mid-infrared (MIR) observations of SN 2006jc in the early phase of dust condensation are essential to examine the composition and properties of the newly formed dust in the SN ejecta and the preexisting dust in the circumstellar medium separately. In this paper, we present the new NIR spectrum and the MIR photometric data of SN 2006jc taken with the Infrared Camera (IRC) (Onaka et al. 2007) on board AKARI, the Japanese infrared satellite (Murakami et al. 2007), on 2006 April 29 (200 days after the discovery or the epoch of 220 days after the explosion). We derive the properties of the carriers of rebrightened NIR emission and the MIR emission to understand the dust formation in SN 2006jc.
2. OBSERVATION AND DATA REDUCTION
Two pointed observations of SN 2006jc were performed at 00:36:22(UT) and 02:15:47(UT) on 2007 April 29 as part of the director's time of AKARI. The former observation (ID:5124071) was performed with the AOT04 mode, in which the MIR spectroscopic data were taken with two grisms, SG1 (5.4–8.4 μm) and SG2 (7.5–12.9 μm), the MIR imaging data were taken with the broadband filter, S9W (6.7–11.6 μm) of the MIR-S channel, the NIR spectroscopic data were taken with the grism, NG (2.5–5.0 μm), and the NIR imaging data were taken with the broadband filter, N3 (2.7–3.8 μm) of the NIR channel. The latter observation (ID:512472) was performed with AOT02b mode, in which the MIR imaging data were taken with two medium-band filters, S7 (5.9–8.4 μm) and S11 (8.5–11.3 μm) of the MIR-S channel and simultaneously, the NIR spectroscopic data was taken with the prism, NP (1.8–5.2 μm), and the NIR imaging data were taken with the broadband filter, N3 (2.7–3.8 μm) of the NIR channel. The target was very faint and the spectrum was seriously affected by the blending with that of the host galaxy UGC4904, which prevent us from obtaining useful spectral information with NG, SG1, and SG2. In the following analysis, we use the spectrum taken with NP as well as the imaging data with N3, S7, S9W, and S11. The total exposure time was 206 s, 206 s, 224 s, 56 s, and 224 s for NP, N3, S7, S9W, and S11, respectively.
Each of the imaging data reduction procedures, including the subtraction of the detector dark current, corrections for the effect of the hit by high-energy ionizing particles and the scattered light (Sakon et al. 2007), the flat fielding, the distortion correction, and the shift and co-addition of the exposure frames for N3, S7, S9W, and S11 bands follows those in the IRC Imaging Pipeline Version 20070912. The unit conversion factors from ADU per unit time to Jy are taken from AKARI IRC Data Users Manual version 1.3. The pixel scale of the NIR channel is 1 46 and that of the MIR-S channel is 234. The FWHM of the image size is 40, 51, 55, and 48 and the peak central pixel flux is 5.9%, 12.0%, 11.5%, and 12.1% for NIR/N3, MIR-S/S7, S9W, and S11, respectively (Onaka et al. 2007). Each of the spectroscopic data reduction procedures, including the subtraction of the detector dark current, correction for the high-energy ionizing particles effects, flat fielding, and the shift and co-addition of the exposure frames for NP data follows those in the IRC Spectroscopy Toolkit Version 20070913 (Ohyama et al. 2007).
Figure 1(a) shows the RGB false color image of SN 2006jc produced with AKARI/IRC NIR/N3(blue), MIR-S/S7(green), and S11(red) bands, where the data taken with N3 and S11 bands are degraded into the Gaussian beam with the FWHM of 51, so that they match with the image size of the S7 band data. SN 2006jc is located close (∼10'') to the nucleus of the host galaxy UGC4904, and the diffuse background or foreground component of UGC4904 must be carefully removed to obtain the flux solely from the SN 2006jc. The photometric decomposition technique employed is described in Section 2.1. The NIR spectral image of SN 2006jc is obtained by the slitless spectroscopy with AKARI/IRC NP (see Figure 1(b)), and it shows that the spectrum of SN 2006jc is seriously blended with that of UGC4904 and a careful subtraction of the UGC4904 component is needed to derive the pure spectrum of SN 2006jc. The spectroscopic decomposition technique employed is also described in Section 2.2.

Figure 1. (a) RGB false color image of SN 2006jc obtained with the AKARI/IRC NIR/N3 (blue), MIR-S/S7 (green), and S11 (red) bands. The image size is 175'' × 200''. (b) Slitless spectroscopic image with NIR/NP covered with 171 pixels by 137 pixels. The spatial scale of each pixel is 146. The horizontal pixel position of each source in (a) corresponds to that of the direct light of each spectrum in (b). The dispersion direction to longer wavelengths is shown with the white arrow. The pixel-to-wavelength relation in (b) is given by λ = 0.4799 × (X − Xd)0.5 + 1.5687, where λ is the wavelength in μm at the horizontal pixel position X, and Xd is the horizontal pixel position of the direct light of the source in concern.
Download figure:
Standard image High-resolution image2.1. Photometric Decomposition Technique
In order to separate the emission carried by the SN 2006jc from that by the host galaxy, the signal count profiles of the host-galaxy component have to be modeled and reproduced. For this purpose, we first derive the most appropriate point-spread function (PSF) in the image and then assume the galaxy component as a convolution of the source with PSF. These procedures are carried out both in the vertical and horizontal directions independently to check the reliability and consistency of the results.
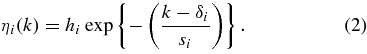
We define the reference pixel row so that it goes across only the host galaxy UGC4904, and obtain the signal count profile P(X) in units of ADU pixel−1 along the reference pixel row (see Figure 2(b)). The position of the reference pixel row is selected so that P(X) has as sharp a profile as possible, and therefore we use P(X) as the PSF. We obtain the signal count profile Pi(X) (i = 1, 2, ..., n) in units of ADU pixel−1 along the ith pixel row (see Figure 2(c)), where n is defined by the number of the pixel rows that cover the SN 2006jc (see Figure 2(a)). Then we assume the signal count profile of the UGC4904 component, PUGC4904i(X), in Pi(X) as a convolution of the PSF written as
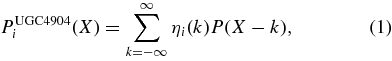
where the distribution function ηi(k) is assumed to have the Gaussian form given by
The best-fit parameters of hi, δi, and si (i = 1, 2, ..., n) are obtained, so that the sum of |Pi(X) − PUGC4904i(X)|2 for 50 ⩽ X ⩽ 69 and 79 ⩽ X ⩽ 90 becomes minimum, where the data of Pi(X) in 70 ⩽ X ⩽ 78 have contribution from the signal of SN 2006jc and have been excluded. The signal count profile of the SN 2006jc component PSN2006jci(X) is then calculated as


Figure 2. Procedures for extracting the emission carried by SN 2006jc adopted for the photometric data taken with AKARI/IRC bands with the emission from the host galaxy UGC4904 separated. (a) The areas of the reference pixel row, the ith target pixel row (i = 1, 2, ..., n), and the test pixel row (see text) are shown over the NIR/N3 band image of SN 2006jc and UGC4904. The image size is 180'' × 200'' and the pixel scale is 146. (b) The signal count profile P(X) in units of ADU pixel−1 along the reference pixel. (c) The signal count profile Pi(X) in units of ADU pixel−1 along the ith target pixel row is shown with thick line and the best-fit result of PUGC4904i(X), the model signal count profile of the UGC4904 component in Pi(X) with Equation (1), is shown with the gray line. (d) The signal count profile Ptest(X) in units of ADU pixel−1 along the test pixel row is shown with the thick line and the best-fit result of PUGC4904test(X), the signal count profile of the UGC4904 component along the test pixel row modeled with Equation (1), is shown with the gray line.
Download figure:
Standard image High-resolution imageIn order to evaluate how well the signal count profile of the UGC4904 component is reproduced by a convolution of the PSF modeled by the signal count profile P(X) obtained along the reference pixel row, we define the test pixel row so that it goes across only the galaxy UGC4904 (see Figure 2(d)), apply the same methods described above to the the signal count profile along the test pixel row Ptest(X), and obtain the best-fit signal count profile PUGC4904test(X) modeled by Equation (1). The standard deviation of the residual profile, Ptest(X) − PUGC4904test(X), from the zero value is only 6.8 ADU pixel−1 for NIR/N3 compared to the peak signal of ∼ 150 ADU pixel−1 (Figure 2(d)), which confirms that the signal count profile of the UGC4904 component is well reproduced by our method. The value of 6.8 ADU pixel−1 is used to estimate the uncertainty in the N3 band flux of SN 2006jc due to the subtraction procedure of the UGC4904 component.
Finally, the total N3 band flux estimated from the analysis on the signal count profiles along the X direction, fXν(N3), is derived as
where αN3 is the unit conversion factor from ADU to Jansky for N3 band (Tanabé et al. 2008). The uncertainty in the N3 band flux of SN 2006jc is calculated as {(σBGN3)2 + (σUGC4904N3)2}0.5, where σBGN3 is the 1σ noise-equivalent flux for NIR N3 band data, taken with the AOT04 mode in units of mJy calculated from the typical fluctuation of the sky counts, and σUGC4904N3 is the uncertainty which stems from the subtraction procedures of the host-galaxy component given by 6.8 × αN3π(n/2)2. Here n is the number of the pixel rows to cover the whole region of SN 2006jc.
The same decomposition techniques are applied in the vertical direction to derive the total N3 band flux, fYν(N3), estimated from the analysis on the signal count profiles along the Y direction. The obtained N3 band fluxes, fXν(N3) and fYν(N3), are listed in Table 1. These two values are in good agreement within uncertainties. We adopted the weighted average of the two values taking account of the error as the final N3 band flux of SN 2006jc.
Table 1. Flux Density of SN 2006jc on 2007 April 29 (200 Days After the Discovery)
| Band | fXν (mJy) | fYν (mJy) |
|---|---|---|
| NIR/N3 | 0.386 ± 0.046 | 0.376 ± 0.042 |
| MIR-S/S7 | 0.586 ± 0.063 | 0.548 ± 0.070 |
| MIR-S/S9W | 0.694 ± 0.098 | 0.735 ± 0.105 |
| MIR-S/S11 | 0.495 ± 0.061 | 0.501 ± 0.098 |
Download table as: ASCIITypeset image
We obtain the flux densities of SN 2006jc with the MIR-S/S7, S9W, and S11 bands using the same decomposition technique as that adopted for the NIR/N3 band, and the results are summarized in Table 1. The flux densities estimated from the signal count profiles along the X and Y directions are in good agreement within uncertainties for any of the MIR-S/S7, S9W, and S11 bands. Finally, we also tried PSF photometry of SN 2006jc using stars in the field and found that the results are the same within the uncertainty. We note that the uncertainty in the subtraction of the host-galaxy light dominates in the photometry uncertainty for both cases, and that the apertures for the photometry used in our methods are adequately large.
2.2. Spectral Decomposition Technique
The NIR spectrum of SN 2006jc is obtained by the slitless spectroscopy with NIR/NP, in which the spectrum is dispersed in the X direction, and a spectrum of a certain source is contaminated by the spectra of other sources aligning in the dispersion direction. Therefore, the spectrum of SN 2006jc suffers severe blending with the light from UGC4904. We have developed a spectral decomposition technique for the spectral image of NIR/NP. We use the imaging data taken with NIR/N3 to investigate the structure of UGC4904 and to reproduce the spectral components of UGC4904 in the spectral image of NIR/NP, and obtain a pure spectrum of SN 2006jc.
For the first step, the position in the Y direction of the NIR/N3 data is adjusted to that of the NIR/NP data with an accuracy of one-tenth of the pixel.
We define the reference pixel row in the imaging data taken with NIR/N3 covering from Y = 28 to Y = 29, so that it goes across only UGC4904 and does not include SN 2006jc (see Figure 3(a)). The signal count profile along the reference pixel row, IY[28:29](X), is obtained by averaging the data from Y = 28 to Y = 29 (see Figure 3(b)). Then we define the target pixel row covering from Y = 20 to Y = 25, so that it goes across the major part of SN 2006jc (see Figure 3(a)), and the signal count profile along the target pixel row, IY[20:25](X), is obtained by averaging the data from Y = 20 to Y = 25 (see Figure 3(c)).

Figure 3. Procedures for extracting the emission carried by SN 2006jc adopted for the spectroscopic data taken with AKARI/IRC NIR/NP, with the emission carried by the host galaxy UGC4904 separated. See text for details.
Download figure:
Standard image High-resolution imageWe model the signal count profile of the UGC4904 component, IUGC4904Y[20:25](X), contained in IY[20:25](X) with
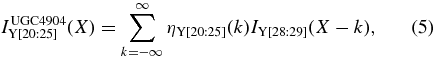
where the free distribution function, ηY[20:25](k), is determined so that the sum of ![$\vert I_{{\rm {Y[20:25]}}}(X) - I_{{\rm {Y[20:25]}}}^{\rm UGC4904}(X) \vert ^2$](https://content.cld.iop.org/journals/0004-637X/692/1/546/revision1/apj295348ieqn1.gif) for 50 ⩽ X ⩽ 69 and 79 ⩽ X ⩽ 100 becomes minimum, where the data of Pi(X) in 70 ⩽ X ⩽ 78 have contribution from the signal of SN 2006jc and have been excluded (see Figure 3(c)). The obtained result of ηY[20:25](k) is shown in Figure 4(a).
for 50 ⩽ X ⩽ 69 and 79 ⩽ X ⩽ 100 becomes minimum, where the data of Pi(X) in 70 ⩽ X ⩽ 78 have contribution from the signal of SN 2006jc and have been excluded (see Figure 3(c)). The obtained result of ηY[20:25](k) is shown in Figure 4(a).
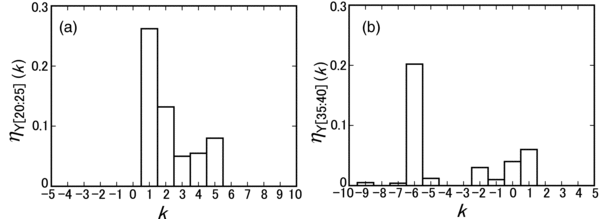
Figure 4. Obtained distribution functions (a) ηY[20:25](k) for target pixel row and (b) ηY[35:40](k) for test pixel row.
Download figure:
Standard image High-resolution imageThen we define the reference pixel row and the target pixel row in the spectral image of NIR/NP, so that each has the same Y range as that defined in the image of NIR/N3. The signal count profiles along the reference pixel row, SY[28:29](X) (see Figure 3(f)), and along the target pixel row, SY[20:25](X) (see Figure 3(g)), in the spectral image of NIR/NP are obtained.
Using the signal count profile along the reference pixel row, SY[28:29](X), and the obtained distribution function ηY[20:25](k), the signal count profile of the UGC4904 component, SUGC4904Y[20:25](X), contained in SY[20:25](X) can be modeled with
which is shown with the gray line in Figure 3(g). The signal count profile of SN 2006jc, SSN2006jcY[20:25](X), contained in SY[20:25](X) is given by

and is shown with the thin black line in Figure 3(g).
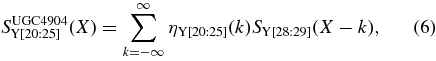
In order to evaluate the accuracy in the estimate of the signal count profile of the UGC4904 component in the spectral image of NIR/NP by this spectral decomposition technique, we define the test pixel row both in the image of NIR/N3 and NP covering from Y = 35 to Y = 40, so that it goes across the host galaxy UGC4904 (see Figures 3(a) and 3(e)) and applied the same technique (see Figures 3(d) and 3(h)).
We model the signal count profile of the UGC4904 component, IUGC4904Y[35:40](X), contained in IY[35:40](X) with
where the free distribution function ηY[35:40](k) is derived in the same way as ηY[20:25](k) (see Figure 3(d)). The obtained result of ηY[35:40](k) is shown in Figure 4(b).
The signal count profile of the UGC4904 component, SUGC4904Y[35:40](X), is given by
The obtained results of SUGC4904Y[35:40](X) and the residual profile given by SY[35:40](X) − SUGC4904Y[35:40](X) are shown with the gray line and the thin line in Figure 3(h), respectively. The standard deviation of the residual profile from zero is 8.1 (ADU pixel−1), which confirms that the signal count profile of the UGC4904 component is properly estimated by our spectral decomposition technique. The value of 8.1 (ADU pixel−1) is used to estimate the systematic error in the spectral decomposition procedure.
We have made the wavelength calibration and the division by the system spectral response of NIR/NP, rNP(λ) in units of ADU mJy−1, for the obtained signal count profile SSN2006jcY[20:25](X) following the procedure in the IRC Spectroscopic toolkit (Ohyama et al. 2007). The absolute flux calibration for the NP spectrum of SN 2006jc has been made by using the ratio of the total flux count of SN 2006jc in IY[20:25](X) to that obtained by the photometric decomposition technique in Section 2.1. The 1σ error of the NP spectrum of SN 2006jc is obtained as {σUGC4904NP(λ)2 + σBGNP(λ)2}0.5, where σUGC4904NP(λ) is the uncertainty in the subtraction of the UGC4904 component in units of mJy, which is given by 8.1/rNP(λ), and σBGNP(λ) is the 1σ noise-equivalent flux for NIR/NP spectrum taken with the AOT04 mode in units of mJy quoted from Ohyama et al. (2007).
3. RESULTS
3.1. The Near- to Mid-Infrared Characteristics of SN 2006jc
The results of the photometry of SN 2006jc with AKARI/IRC N3, S7, S9W, and S11 bands are listed in Table 2. NIR photometry of SN 2006jc with H and K bands was performed simultaneously on and 2007 April 28 and 29 (Minezaki et al. 2007), using the multicolor imaging photometer (MIP) mounted on the MAGNUM 2 m telescope at Haleakala Observatories in Hawaii (Kobayashi et al. 1998a, 1998b), and the results are summarized also in Table 2.
Table 2. Results of the Photometry of SN 2006jc on 2007 April 29 (200 Days after the Discovery)
| Instrument | Band | λband (μm) | Flux Density (mJy) |
|---|---|---|---|
| MAGNUM/MIP | H | 1.6 | 0.05 ± 0.02 |
| MAGNUM/MIP | K | 2.2 | 0.14 ± 0.02 |
| AKARI/IRC | N3 | 3.2 | 0.38 ± 0.04 |
| AKARI/IRC | S7 | 7.0 | 0.57 ± 0.07 |
| AKARI/IRC | S9W | 9.0 | 0.71 ± 0.10 |
| AKARI/IRC | S11 | 11.0 | 0.50 ± 0.10 |
Download table as: ASCIITypeset image
The obtained NIR spectrum of SN 2006jc on day 200, together with the photometric results are plotted in Figure 5. The NIR spectrum of SN 2006jc is characterized by a continuum emission peaking around at ∼ 4 μm, which can be attributed to the thermal emission from dust grains. Possible atomic hydrogen recombination lines of Pf-ζ at 2.87 μm, Pf- at 3.04 μm, Pf-δ at 3.30 μm, Pf-γ at 3.74 μm, Br-α at 4.07 μm, and Br-β at 2.63 μm are recognized, though they are significant only within 2σ–3σ (see Figure 5). We also note a small dent around at 4.6 μm, possibly attributed to the CO absorption band.

Figure 5. NIR spectrum of SN 2006jc on day 200 after the discovery with AKARI/IRC NIR/NP. Photometric data taken with MAGNUM/MIP H, K bands (open square), and with AKARI/IRC NIR/N3, MIR-S/S7, S9W, S11 bands (solid square) are plotted together. The 1σ error level in the NP spectrum are also shown.
Download figure:
Standard image High-resolution image3.2. Emission from the Newly Formed Dust in the NIR
Assuming that spherical dust grains of a certain kind X with a uniform particle radius aX and a total mass of MX are located at a distance of R from the observer, and that they emit optically thin thermal radiation of the temperature of TX(K), the observed flux density profile is given by
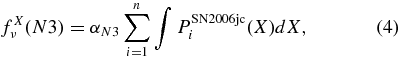
where QabsX(λ) is the absorption efficiency and ρX is the density of a dust particle of composition X. The NIR spectral energy distribution (SED) of SN 2006jc on day 200 of H- and K-band photometric data and the 2–5 μm spectroscopic data is fitted with fXν(λ) for each case of the amorphous carbon (X = a.car.), and the astronomical silicate (X = a.sil.) as a composition of dust. We assume the distance of R = 25.8 Mpc (Pastorello et al. 2007) for SN 2006jc.
In the following analysis aX is set as 0.01 μm, taking account of the fact that the average radius of the newly formed dust in the expanding ejecta is less than 0.01 μm due to the low density and the rapid cooling timescale of the ejecta gas (Nozawa et al. 2008).
As for the amorphous carbon case, the absorption efficiency, Qabsa.car.(λ), for a spherical amorphous carbon grain with a radius of aa.car. = 0.01 μm is calculated from the optical constants of Edo (1983). Assuming ρa.car. = 2.26 g cm−3, the fit is carried out with the equilibrium temperature Ta.car. and the total mass Ma.car. being free parameters. The result of the fit is shown in Figure 6(a), and the best-fit parameters of Ta.car. = 800 ± 10 K and Ma.car. = 6.9 ± 0.5 × 10⁻⁵ M☉ are obtained.

Figure 6. Near- to mid-infrared SED of SN 2006jc on day 200 constructed by the H- and K-band photometric data (open square), the 2–5 μm spectroscopic data (thin cross), and the MIR photometric data (solid square). The results of the best-fit spectrum modeled with Equation (10) to reproduce the NIR data are shown for the case of (a) amorphous carbon (X = a.car.) and (b) astronomical silicate (X = a.sil.). The flux density at AKARI/IRC NIR/N3, MIR-S/S7, S9W, and S11 bands simulated for the model spectrum taking account of the color correction is shown with the thick crosses.
Download figure:
Standard image High-resolution imageThe flux density at each AKARI/IRC imaging band is calculated for the model spectrum taking account of the color correction, which is given by
where Rband(ν) is the relative system spectral response of each AKARI/IRC band, and νband = c/λband corresponds to the reference frequency of each AKARI/IRC band defined with λN3 = 3.2 μm, λS7 = 7.0 μm, λS9W = 9.0 μm, and λS11 = 11.0 μm (Onaka et al. 2007). The model values that were converted into the AKARI/IRC calibration system of fa.car.ν(N3), fa.car.ν(S7), fa.car.ν(S9W), and fa.car.ν(S11) are plotted by crosses in Figure 6(a). The observed data at S7, S9W, and S11 bands have excess emission over fa.car.ν(S7), fa.car.ν(S9W), and fa.car.ν(S11), respectively. The interpretation for the excess component is discussed in Section 4.
As for the silicate case, the absorption efficiency, Qabsa.sil.(λ), for a spherical astronomical silicate grain with a radius of aa.car. = 0.01 μm is taken from the values in Draine (1985), and ρa.sil. = 3.3 g cm−3 is assumed. The fit was carried out in the same way as for the amorphous carbon grains. The result of the fit is shown in Figure 6(b), and the best-fit parameters of Ta.sil. = 920 ± 10 K and Ma.sil. = 4.2 ± 0.3 × 10⁻⁴ M☉ are obtained. The flux density at N3, S7, S9W, and S11 bands is calculated for the best-fit model spectrum, taking account of the color correction and is shown in Figure 6(b). The model values of fa.sil.ν(S7), fa.sil.ν(S9W), and fa.sil.ν(S11) largely exceed the observed flux density at S7, S9W, and S11 bands. The disagreement in the MIR flux shows that astronomical silicate is not a likely carrier of the continuum in the 2–5 μm region on day 200.
We conclude that amorphous carbon is a likely carrier of the NIR continuum on day 200. The spectrum is well accounted for by the amorphous carbon dust with the temperature of 800 ± 10 K and with the total mass of Ma.car. = 6.9 ± 0.5 × 10⁻⁵ M☉. This result is consistent with the suggestion made by Smith et al. (2008) that the rebrightened NIR emission on 79 days is likely to be carried by carbonaceous dust with an equilibrium temperature of 1600 K, but not by silicate dust. The equilibrium temperature of 800 K on day 200 derived in our analysis is consistent with the scenario that this component is newly formed dust in the free-expanding ejecta of the SN (Nozawa et al. 2008), in which the illuminating radiation is assumed to be the thermal emission from the gas ejecta heated by γ-rays and positrons produced via the decay of radioactive elements such as 56Ni and 56Co (Tominaga et al. 2008).
4. THE CARRIERS OF THE MIR EXCESS COMPONENT
The MIR excess component is seen over the model spectrum of the amorphous carbon of 800 K at the S7, S9W, and S11 bands. One possible candidate for the excess component is the dust with an emission band in the MIR region carried by silicate and/or amorphous silica dust, which is discussed in Section 4.1. Another possible candidate for the excess component is the thermal emission from the dust with temperature lower than 800 K. The properties of the lower temperature dust are discussed in Section 4.2. In Section 5.1, we discuss which one of these two candidates is more likely.
In the following analysis, we model the near- to mid-infrared spectrum as a combination of N kinds of dust components (Xi; i = 1, ..., N), including the amorphous carbon discussed in Section 3.2, and then the model spectrum is calculated as
where the fit parameters  and
and  are the mass and the temperature of the dust component Xi, and
  ,
,  , and
, and  are the absorption efficiency, grain radius, and the density of dust Xi, respectively.
4.1. Silicate and/or Amorphous SiO2 Model
One possible candidate for the excess emission in S7, S9W, and S11 bands is the dust band emission of the silicate and/or amorphous silica dust. In Figure 7, the absorption-efficiency profiles QabsX(λ) of amorphous carbon (X = a.car.) from Edo (1983), astronomical silicate (X = a.sil.) from Draine (1985), and amorphous SiO2 (X = silica) from Philipp (1985) are shown together with the system spectral response curve of the AKARI/IRC NIR/N3, MIR-S/S7, S9W, and S11 bands. While Qabsa.car.(λ) shows a smooth featureless profile without any band structures, Qabsa.sil.(λ) and Qabssilica(λ) show the band structure peaking at ∼ 9.5–10.0 μm and ∼ 8.5–9.0 μm, respectively. Therefore, these band structures intrinsic to the silicate-related dust could contribute to the excess emission in S7, S9W, and S11 bands.
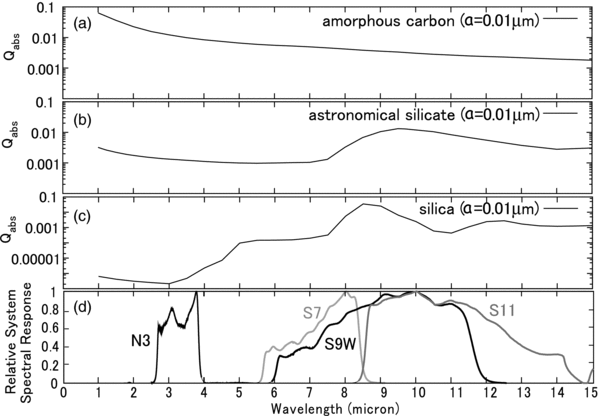
Figure 7. Absorption-efficiency profile QabsX(λ) of (a) amorphous carbon (X = a.car.), (b) astronomical silicate (X = a.sil.), and (c) amorphous SiO2 (X = silica). (d) The system spectral response curve of AKARI/IRC NIR/N3, MIR-S/S7, S9W, and S11 bands.
Download figure:
Standard image High-resolution imageFirstly, a two-component (N = 2) model of the amorphous carbon (X1 = a.car.) and the astronomical silicate (X2 = a.sil.) is employed. The near- to mid-infrared data of SN 2006jc on day 200 are fitted with Equation (12), where Ta.car. = 800 K and Ma.car. = 6.9 × 10⁻⁵ M☉ are fixed, and Ta.sil. and Ma.sil. are taken as the free parameters. The grain radii of both components are set as 0.01 μm. The best-fit model spectrum is shown in Figure 8(a), and we obtain Ta.sil. = 710 ± 10 K and Ma.sil. = 1.12 ± 0.02 × 10⁻⁴ M☉.
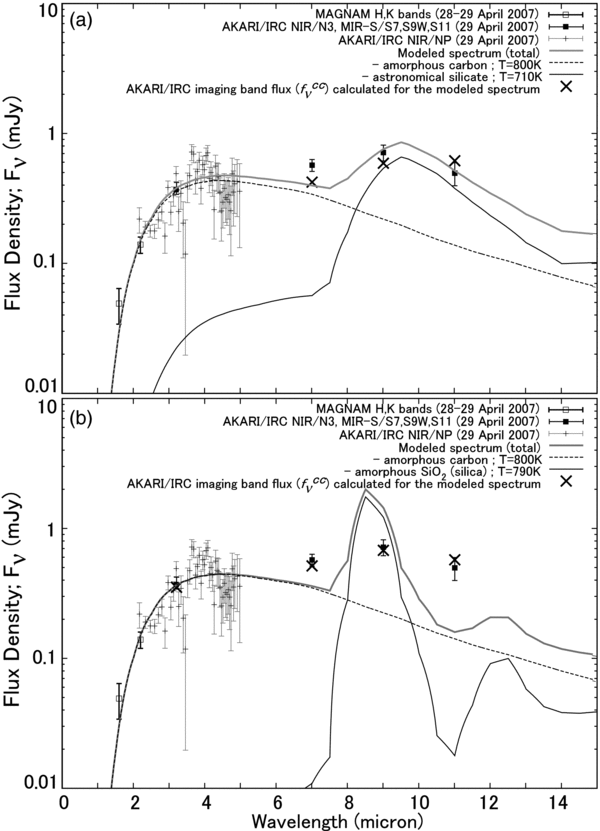
Figure 8. Best-fit model spectra with Equation (12) for the case of two-component (N = 2) models made of (a) amorphous carbon (X1 = a.car.) and astronomical silicate (X2 = a.sil.), and (b) amorphous carbon (X1 = a.car.) and amorphous SiO2 (X2 = silica). Symbols are the same as in Figure 6.
Download figure:
Standard image High-resolution imageHowever, the flux densities in S7, S9W, and S11 bands predicted for this two-component (amorphous carbon + astronomical silicate) model taking account of the color correction cannot well reproduce the observed MIR SED characterized by the enhanced S9W flux density (see Figure 8(a)). For one thing, the band structure of astronomical silicate peaking at ∼ 9.5–10.0 μm is almost fully included not only in S9W, but also sometimes more efficiently depending on the dust temperature in S11. For the other, the predicted model spectrum is too low in 6 < λ < 8.5 μm, where the S11 band does not have its sensitivity, but the S9W band does. Therefore, we need to have another dust component that has a band structure in λ < 8.5 μm in its absorption-efficiency profile. Amorphous SiO2 (silica) is one of the candidates for such component (see Figure 7(c)). Moreover, silica should be able to be produced in SN ejecta (Nozawa et al. 2003, 2007). Its presence in the Cas An SN remnant has been reported by a MIR spectroscopic observation with the Short Wavelength Spectrometer (SWS) on board the Infrared Space Observatory (ISO; Douvion et al. (2001) and also by a recent Spitzer observation (Rho et al. 2008).
We assume a two-component (N = 2) model consisting of hot amorphous carbon (X1 = a.car.) and amorphous silica (X2 = silica), where Ta.car. = 800 K and Ma.car. = 6.9 × 10⁻⁵ M☉ are fixed, and Tsilica and Msilica are taken as the free parameters. The grain radii of both components are set to be 0.01 μm, and we assume the density of amorphous SiO2 ρsilica = 2.62 g cm−3. The best-fit model spectrum is shown in Figure 8(b), and we obtain Tsilica = 790 ± 10 K and Msilica = 6.5 ± 0.1 × 10⁻⁵ M☉. This time, the predicted flux densities are in good agreement with the MIR SED characterized by the enhanced S9W flux density.
4.2. Two-Temperature Amorphous Carbon Dust Model
Another possible candidate for the excess component is the thermal emission from the featureless dust with temperature lower than 800 K. Our NIR to MIR data of SN 2006jc on day 200 are fitted with Equation (12), assuming a two-component (N = 2) model of hot amorphous carbon (X1 = h.a.car.) and warm amorphous carbon (X2 = w.a.car.). The temperature and the integrated mass of the former component are fixed to the values obtained in Section 3.2 and those of the latter component, Tw.a.car. and Mw.a.car., are taken as the free parameters. The same properties of the absorption-efficiency profile, the grain radius and the density are assumed both for the warm and hot components. The fitting is made, so that the flux densities of the model spectrum at S7, S9W, and S11 bands that were converted into the AKARI/IRC calibration system should best reproduce the observed flux density at S7, S9W, and S11 bands. The best-fit model spectrum is shown in Figure 9, and we obtain Tw.a.car. = 320 ± 10 K and Mw.a.car. = 2.7+0.7−0.5 × 10⁻³ M☉ 10−3 M☉.

Figure 9. Results of the best-fit spectrum with Equation (12) are shown for the case of two-component (N = 2) models made of two-temperature amorphous carbons (X1 = h.a.car. and X2 = w.a.car.). Symbols are the same as in Figure 6.
Download figure:
Standard image High-resolution image
We note that the observed NIR to MIR SED has double-peaked characteristics, with one peak being located in the NIR and the other peak in the MIR, and that the model fit with two-temperature amorphous carbon dust results in a considerable temperature gap between the two. This temperature gap can be explained if we assume the situation such that only the hot component with the temperature of 800 K is the newly formed dust in the ejecta of SN 2006jc, and that the 320 K warm component corresponds to thermal emission from the preexisting circumstellar dust farther away from the newly formed dust with a dust-depleted region in between. The dust-depleted region may have been created by the dust evaporation due to the shock breakout in the initial phase of the SN explosion.
5. DISCUSSION
5.1. Compositions of Dust Around the SN 2006jc
Observational evidence for the presence of silicate and/or silica grains formed in SN ejecta has been reported for the Cas A SN remnant (Douvion et al. 2001; Rho et al. 2008, and references therein) and SN 2003gd (Sugerman et al. (2006), and the presence of silicate dust in the CSM is confirmed for SN 1987A (Bouchet et al. 2006). Ercolano et al. (2007) have shown that no more than 15% by mass of dust in the SN 1987A has been in the form of silicates, whilst Sugerman et al. (2006) have reported that the dust that condensed around SN 2003gd has been predominantly silicate.
The progenitor of Type Ib SN 2006jc is considered to be a Wolf–Rayet star, suffering the mass loss during its late evolution and forming a dense He-rich CSM (Foley et al. 2007). The He layer of core-collapse SNe is suggested to contain more carbon than oxygen (Nomoto & Hashimoto 1988) and, especially, the Wolf–Rayet star with strong mass loss leads to thick C-rich CSM and envelope (Limongi & Chieffi 2006; Tominaga et al. 2008). Therefore, the formation of silicate and/or silica grains in the C-rich CSM of SN 2006jc is less likely (e.g., Nozawa et al. 2003).
Even if the silicate and/or silica dust is newly formed in the ejecta of SN 2006jc, their temperature reaches only up to 100 K taking account of the optical absorption and the collision with ejecta gas with 1000 K on day ∼ 200 after the discovery (Nozawa et al. 2008). AKARI/IRC S7/S11 band colors calculated for astronomical silicate and silica with 100 K are fa.silν(S7)/fa.sil.ν(S11) = 5.2 × 10⁻³ and fsilicaν(S7)/fsilicaν(S11) = 4.1 × 10⁻², respectively, which are by far smaller than the S7/S11 band color of ∼0.5 ± 0.2 obtained for the observed MIR excess component. Therefore, both the astronomical silicate and amorphous silica with 100 K cannot reproduce the flux density at S7, S9W, and S11 bands of the excess component and should not be the major carriers of the excess. Consequently, the MIR excess component over the model spectrum of the amorphous carbon of 800 K is likely to be IR light echo by amorphous carbon with 320 ± 10 K in the CSM discussed in Section 4.2, and we conclude that amorphous carbon of 800 ± 10 K of 6.9 ± 0.4 × 10⁻⁵ M☉ is newly formed in the ejecta of SN 2006jc on day 200.
The present analysis assumes a single grain size of 0.01 μm. As far as the size is small compared to the wavelength in question, the derived dust mass does not depend on the grain size. The grain temperature is a slow function of the grain size, and thus the introduction of the size distribution will not affect the mass estimate. In particular, the nucleation model suggests the formation of very small grains in the very rapid cooling gas of SN 2006jc (Nozawa et al. 2008). In the present analysis, we did not apply a thorough radiative transfer and employed a single-temperature approximation because the uncertainties in the observational results are too large to warrant detailed modeling. As far as the dust-forming layer is thin and does not have a significant temperature gradient, a single temperature provides a reasonable approximation for the emission from the shell. The major aim of the present analysis is to discuss the nature and origin of the infrared emission detected by the present observations, and is not intended to derive an accurate estimate of the dust mass.
On the other hand, Mattila et al. (2008) have also presented the Spitzer IRAC photometric data obtained at the similar epoch to ours and explained their data in terms of the dust formation in the cool dense shell (CDS) produced by the interaction of the ejecta onward shock with a dense shell of the circumstellar material ejected by the progenitor. They obtained 3 × 10⁻⁴ M☉ of amorphous carbon as the mass of newly formed dust.
In any cases, the newly formed dust mass around the SN 2006jc is more than 3 orders of magnitude smaller than the amount needed for core-collapse SNe to contribute efficiently to the early-universe dust budget (Morgan & Edmunds 2003). Recent observational studies report the evidence of dust formation in the ejecta of several core-collapse SNe, but the produced dust mass in the SN ejecta is generally found to be much smaller than theoretically predicted values of 0.1–1 M☉ (Nozawa et al. 2003), i.e., no more than 7.5 × 10⁻⁴ M☉ for SN 1987A (Ercolano et al. 2007), ∼10−4 M☉ for SN 1999em (Elmhamdi et al. 2003), and 4 × 10⁻⁵ M☉ for SN 2003gd (Meikle et al. 2007). The obtained amorphous carbon dust mass for SN 2006jc on day 200 in our study is consistent with those relatively small values obtained for other several dust-forming core-collapse SNe, although our data is almost insensitive to the newly formed silicate of ∼ 100 K.
In addition to the dust formed in the ejecta, on the other hand, our MIR photometric data suggest the presence of another amorphous carbon dust of 320 ± 10 K of 2.7+0.7−0.5 × 10⁻³ M☉ as the circumstellar component. This component is expected to be formed in the mass-loss wind associated with the Wolf–Rayet stellar activity (e.g., Williams et al. 1992; Waters et al. 1997; Molster et al. 1999; Voors et al. 2000). It follows that the dust condensation not only in the SN ejecta itself, but also in the mass-loss wind associated with the prior events to the SN explosion could make a significant contribution to the dust formation by a massive star in its whole evolutional history.
6. SUMMARY
We present our latest results on NIR to MIR observations of SN 2006jc at 200 days after the discovery using the IRC on board AKARI. The NIR (2–5 μm) spectrum of SN 2006jc is obtained for the first time, and is found to be well interpreted in terms of the thermal emission from amorphous carbon of 800 ± 10 K of 6.9 ± 0.5 × 10⁻⁵ M☉ that was formed in the SN ejecta. This newly formed dust mass in the SN ejecta is in a range similar to those obtained for other several dust-forming core-collapse SNe based on recent observations. MIR photometric data with AKARI/IRC MIR-S/S7, S9W, and S11 bands have shown excess emission over the thermal emission of amorphous carbon of 800 K. This MIR excess emission is likely to be accounted for by the emission from circumstellar amorphous carbon dust of 320 ± 10 K of 2.7+0.7−0.5 × 10⁻³ M☉ rather than by the band emission of astronomical silicate and/or silica grains. Since this circumstellar amorphous carbon dust of 320 K is expected to be formed in the mass-loss wind associated with the Wolf–Rayet stellar activity, our result suggests that a significant amount of dust is condensed in the mass-loss wind associated with the prior events to the SN explosion. MIR spectroscopy of early-time SNe of similar type is highly important for further and detailed analysis on the properties of newly formed dust in the SN ejecta, distinguishing from the circumstellar or interstellar dust component.
This work is based on observation of AKARI, a JAXA project with the participation of ESA. We thank all the members of the AKARI project, particularly those who have engaged in the observation planning and the satellite operation during the performance verification phase, for their continuous help and support. We would also express our gratitude to the AKARI data reduction team for their extensive work in developing data analysis pipelines. This work is supported in part by a grant-in-aid for Scientific Research on Priority Areas from the Ministry of Education, Culture, Sports, Science, and Technology of Japan and grants-in-aid for Scientific Research from the JSPS.